Sketch
require(["esri/widgets/Sketch"], function(Sketch) { /* code goes here */ });esri/widgets/SketchSketch widget provides a simple UI for creating and updating graphics on a MapView or a SceneView. This significantly minimizes the code required for working with graphics in the view. It is intended to be used with graphics stored in its layer property.
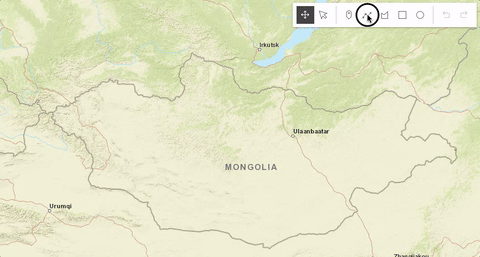
By default, the Sketch widget provides out-of-the-box tools for creating and updating graphics with point, polyline, polygon, rectangle and circle geometries.
Known Limitations
Read more
Pointer and keyboard gestures for creating graphics with different geometries are described in the tables below.
Creating point graphics
| Gesture | Action |
|---|---|
| Left-click | Adds a point graphic at the pointer location. |
| C | Adds a point graphic at the pointer location. |
Creating polyline and polygon graphics
| Gesture | Action |
|---|---|
| Left-click | Adds a vertex at the pointer location. |
| Left-drag | Adds a vertex for each pointer move. |
| F | Adds a vertex to the polyline or polygon graphic. |
| C | Completes the polyline or polygon graphic sketch. |
| Z | Incrementally undo actions recorded in the stack. |
| R | Incrementally redo actions recorded in the stack. |
| Spacebar+Left-drag | Pan the view while creating a polyline or polygon graphic. |
| Left-click on the first vertex | Completes the polygon graphic sketch. |
Creating polygon graphics with predefined shapes
The following keyboard shortcuts apply when creating polygon graphics with predefined shapes.
| Gesture | Action |
|---|---|
| Left-click+Drag | Creates a rectangle graphic with dimensions based on the bounding box between initial click and cursor location. Creates a circle graphic with radius based on the distance between initial click and cursor location. |
| Ctrl+Left-click+Drag | Changes the shape from a rectangle to a square or from a circle to an ellipse. |
| Alt+Left-click+Drag | Creates a rectangle graphic with a center at initial click, and dimensions based on the distance between the initial click to the cursor location. Creates a circle graphic with a radius based on the bounding box between the initial click and the cursor location. |
| Ctrl+Alt+Left-click+Drag | Combines the behavior described above. |
Updating graphics
The Sketch widget provides users with the ability to move, rotate, scale or reshape graphics during an update operation. To begin updating, Left-click on a graphic. Use Shift+Left-click to add more graphics to the selection, for bulk updating. Once graphics are selected, the following actions can be performed.
| Gesture | Action | Example |
|---|---|---|
| Left-click on a graphic | Select a graphic to move, rotate or scale. | 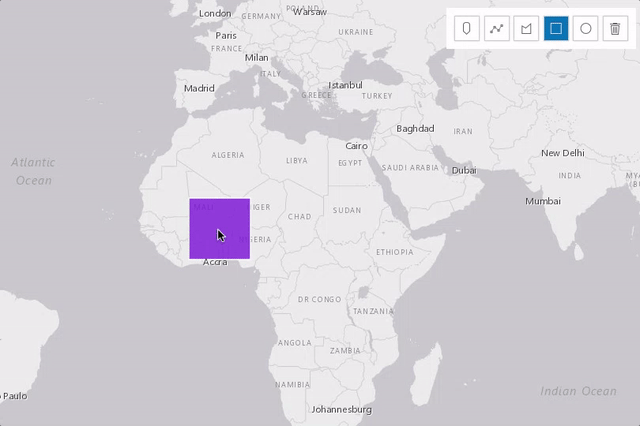 |
| Shift+Left-click graphics | Select multiple graphics to move, rotate or scale. | 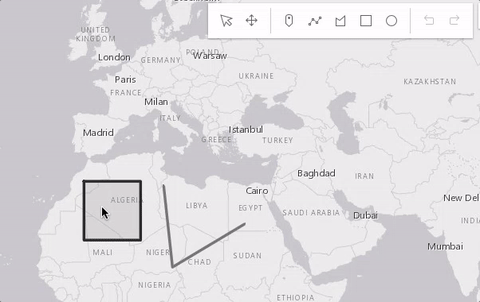 |
| Drag graphic | Move the selected graphic. | 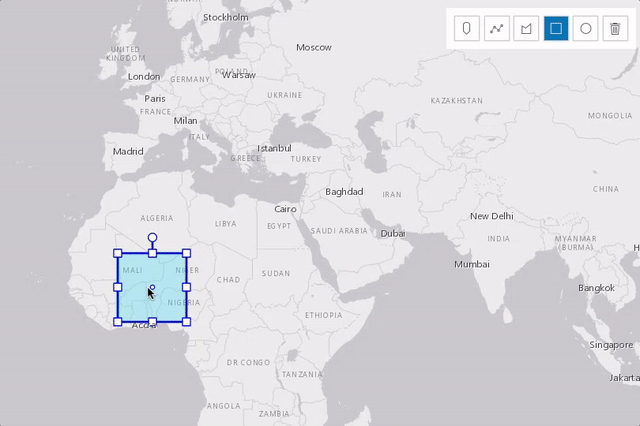 |
| Drag rotate handle | Rotate the selected graphic. | 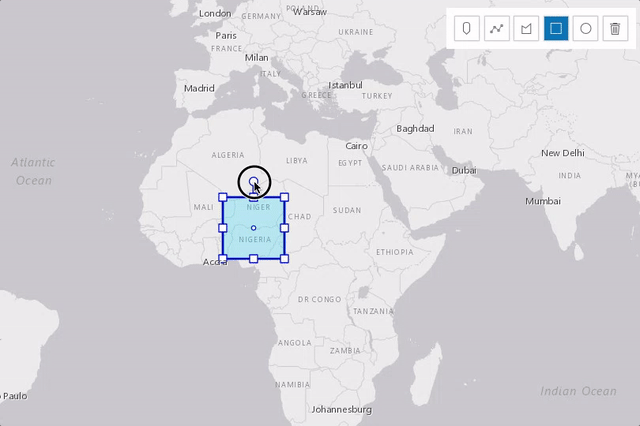 |
| Drag scale handle | Scale the selected graphic. | 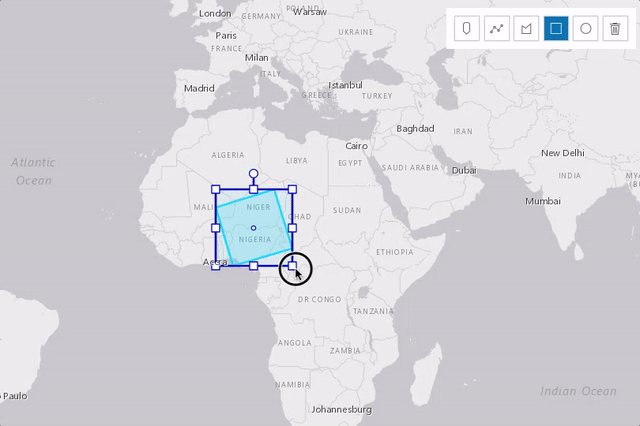 |
| Z | Incrementally undo actions recorded in the stack. | 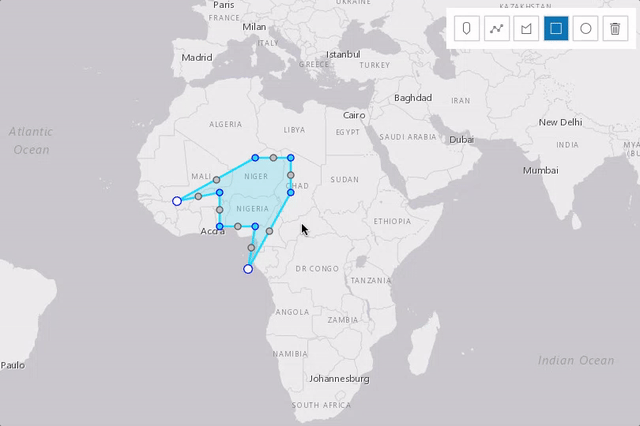 |
| R | Incrementally redo actions recorded in the stack. |  |
| Left-click on view (not the graphic) | Complete the graphic update. | 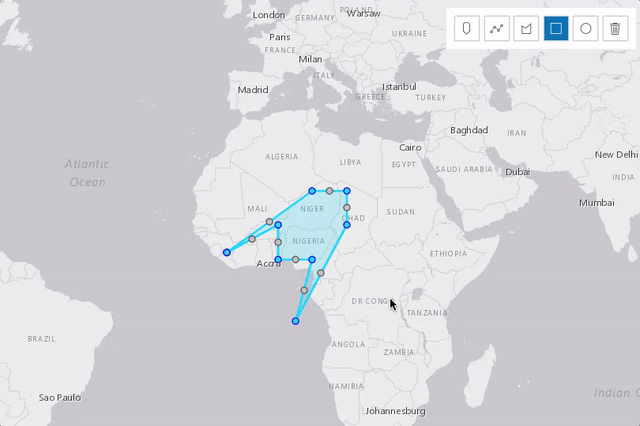 |
Press Delete key | Remove the selected graphic(s) from the layer. | 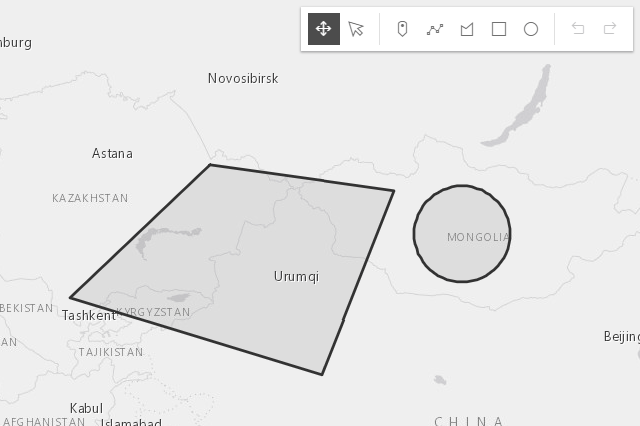 |
The following update operations can be performed on a single polyline or polygon graphic:
| Gesture | Action | Example |
|---|---|---|
| Left-click on a graphic | Select a graphic to move or reshape. | 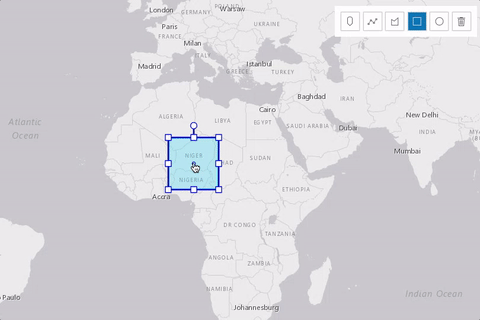 |
| Drag graphic | Move the selected graphic. | 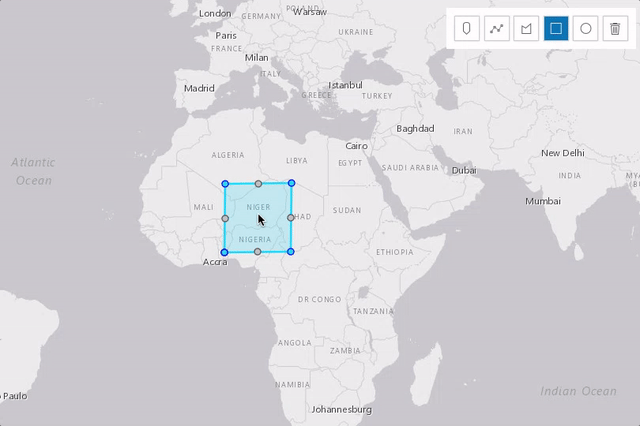 |
| Left-click on a ghost vertex | Add a new vertex. | 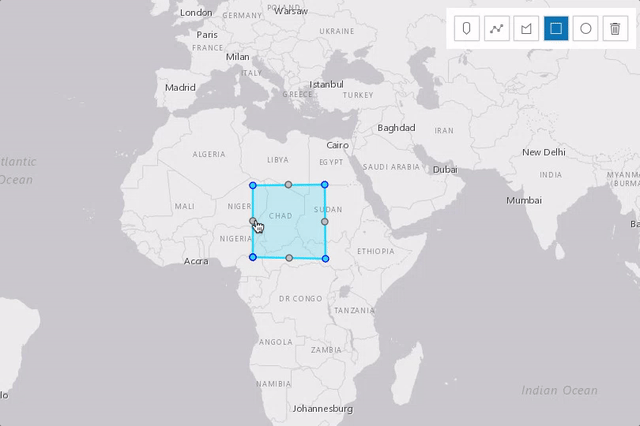 |
| Left-click on a vertex | Select a vertex. | 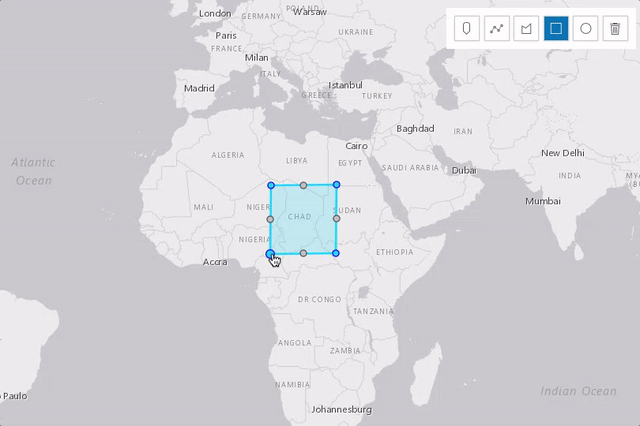 |
| Shift+Left-click on vertices | Select or unselect multiple vertices. | 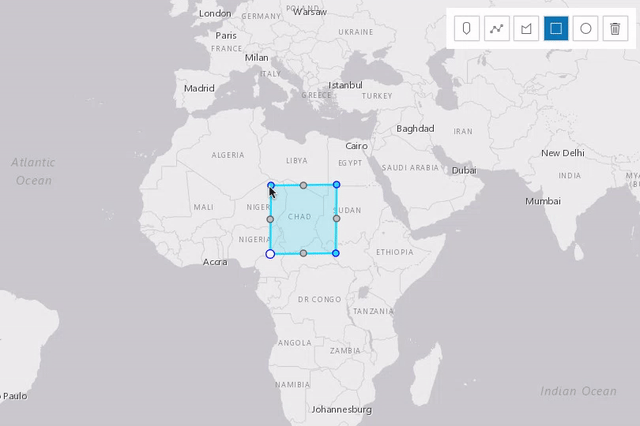 |
| Drag vertex | Move the selected vertex or vertices. |  |
| Right-click on a vertex | Delete a vertex. | 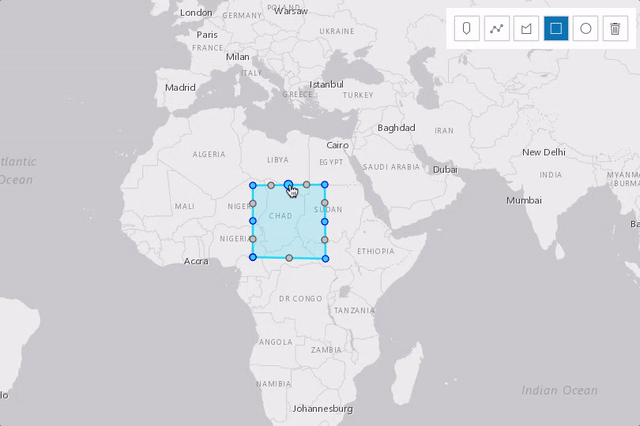 |
Select multiple vertices and press Backspace or Delete key | Delete multiple vertices. | 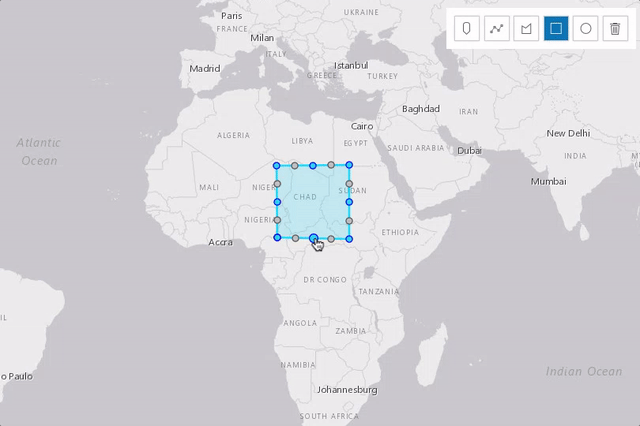 |
The following update operations can be performed on a single graphic with point geometry in a SceneView, if the graphic uses a 3D object symbol layer:
| Gesture | Action | Example |
|---|---|---|
| Left-click on a graphic | Select a graphic to move, rotate or scale. |  |
| Drag inner handle | Move the selected graphic. | 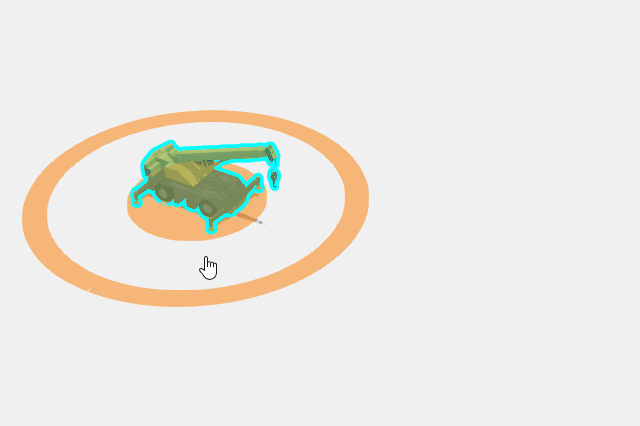 |
| Drag outer handle sideways | Rotate the selected graphic. | 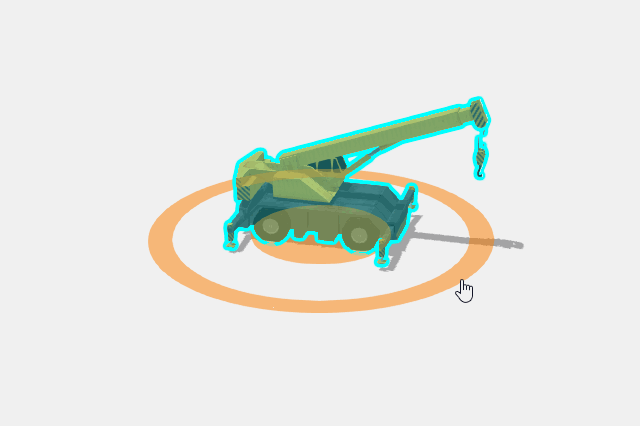 |
| Drag outer handle inwards or outwards | Scale the selected graphic. | 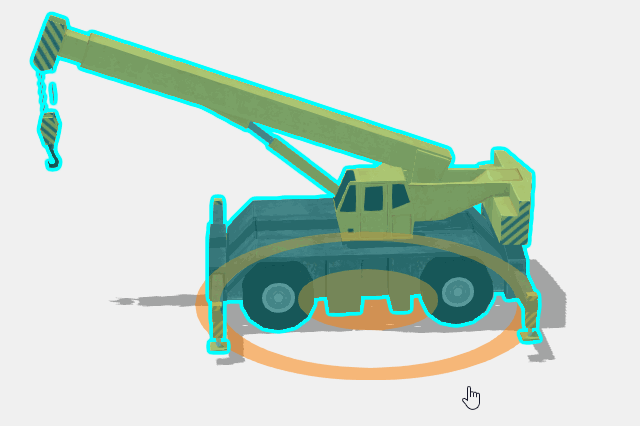 |
- See also:
// Create a new instance of sketch widget and set
// its required parameters
var sketch = new Sketch({
  layer: graphicsLayer,
  view: view
});

// Listen to sketch widget's create event.
sketch.on("create", function(event) {
  // check if the create event's state has changed to complete indicating
  // the graphic create operation is completed.
  if (event.state === "complete") {
    // remove the graphic from the layer. Sketch adds
    // the completed graphic to the layer by default.
    polygonGraphicsLayer.remove(event.graphic);

    // use the graphic.geometry to query features that intersect it
    selectFeatures(event.graphic.geometry);
  }
});
Constructors
- new Sketch(properties)
- Parameter:properties Objectoptional
See the properties for a list of all the properties that may be passed into the constructor.
Example:// typical usage var sketch = new Sketch({ layer: layer, view: view });
Property Overview
| Name | Type | Summary | Class | |
|---|---|---|---|---|
| String | When creating new graphics (for example after create() has been called), this property reflects the create tool being used. more details | more details | Sketch | |
| String[] | Property controlling the visibility and order of create tool buttons. more details | more details | Sketch | |
| String|HTMLElement | The ID or node representing the DOM element containing the widget. more details | more details | Widget | |
| Graphic | The graphic that is being created. more details | more details | Sketch | |
| String | Defines the default behavior once the create operation is completed. more details | more details | Sketch | |
| String | The name of the class. more details | more details | Accessor | |
| Object | Default create options set for the Sketch widget. more details | more details | Sketch | |
| Object | Default update options set for the Sketch widget. more details | more details | Sketch | |
| Boolean | When | more details | Widget | |
| String | The Sketch widget's default CSS icon class. more details | more details | Sketch | |
| String | The unique ID assigned to the widget when the widget is created. more details | more details | Widget | |
| String | The Sketch widget's default label. more details | more details | Sketch | |
| GraphicsLayer | The GraphicsLayer associated with the Sketch widget. more details | more details | Sketch | |
| String | Determines the layout/orientation of the Sketch widget. more details | more details | Sketch | |
| String | The Sketch widget's state. more details | more details | Sketch | |
| Collection<Graphic> | An array of graphics that are being updated by the Sketch widget. more details | more details | Sketch | |
| MapView|SceneView | A reference to the MapView or SceneView. more details | more details | Sketch | |
| SketchViewModel | The view model for the Sketch widget. more details | more details | Sketch |
Property Details
- activeTool Stringreadonly
When creating new graphics (for example after create() has been called), this property reflects the create tool being used. When updating graphics (for example after update() has been called), this property reflects the update tool being used. If no create or update operation is in progress, this is
null.Possible Values:"point"|"polyline"|"polygon"|"circle"|"rectangle"|"move"|"transform"|"reshape"
- Since: ArcGIS API for JavaScript 4.12
Property controlling the visibility and order of create tool buttons.
- Default Value:["point", "polyline", "polygon", "rectangle", "circle"]
The ID or node representing the DOM element containing the widget. This property can only be set once. The following examples are all valid use cases when working with widgets.
Examples:// Create the HTML div element programmatically at runtime and set to the widget's container const basemapGallery = new BasemapGallery({ view: view, container: document.createElement("div") }); // Add the widget to the top-right corner of the view view.ui.add(basemapGallery, { position: "top-right" });// Specify an already-defined HTML div element in the widget's container const basemapGallery = new BasemapGallery({ view: view, container: basemapGalleryDiv }); // Add the widget to the top-right corner of the view view.ui.add(basemapGallery, { position: "top-right" }); // HTML markup <body> <div id="viewDiv"></div> <div id="basemapGalleryDiv"></div> </body>// Specify the widget while adding to the view's UI const basemapGallery = new BasemapGallery({ view: view }); // Add the widget to the top-right corner of the view view.ui.add(basemapGallery, { position: "top-right" });
- createGraphic Graphicreadonly
The graphic that is being created.
- creationMode StringSince: ArcGIS API for JavaScript 4.14
Defines the default behavior once the create operation is completed. By default, the user will be able to continuously create graphics with same geometry types.
Possible Values:
Value Description continuous This is the default. Users can continue creating graphics with same geometry types. single User can create a single graphic with the specified geometry type. User must choose an operation once the graphic is created. update The graphic will be selected for an update operation once the createoperation is completed.Possible Values:"single"|"continuous"|"update"
- Default Value:continuous
The name of the class. The declared class name is formatted as
esri.folder.className.
- defaultCreateOptions ObjectSince: ArcGIS API for JavaScript 4.14
Default create options set for the Sketch widget.
- Property:
- optionalmode String
Create operation mode how the graphic can be created.
Possible Values:
Value Description hybrid This is the default. Vertices are added while the pointer is clicked or dragged. Applies to and is the default for polygonandpolyline.freehand Vertices are added while the pointer is dragged. Applies to polygon,polylinerectangleandcircle. Default forrectangleandcircle.click Vertices are added when the pointer is clicked.
- defaultUpdateOptions ObjectSince: ArcGIS API for JavaScript 4.11
Default update options set for the Sketch widget. Update options set on this property will be overwritten if the update options are changed when update() method is called.
- Properties:
- optionaltool String
Name of the update tool. The default tool is
transformfor graphics with polygon and polyline geometries andmovefor graphics with point and multipoint geometries. However, if a graphic with point geometry uses a 3D object symbol layer, the default tool istransform.optionalenableRotation BooleanDefault Value:trueIndicates if the
rotationoperation will be enabled when updating graphics. Only applies iftoolistransform.optionalenableScaling BooleanDefault Value:trueIndicates if the
scaleoperation will be enabled when updating graphics. Only applies iftoolistransform.optionalmultipleSelectionEnabled BooleanDefault Value:trueIndicates whether more than one selection can be made at once. This pertains to shift+click interaction with the
transformtool.optionalpreserveAspectRatio BooleanDefault Value:falseIndicates if the uniform scale operation will be enabled when updating graphics.
enableScalingmust be settruewhen setting this property totrue. Only applies iftoolistransformand is alwaystruewhen transforming points that use a 3D object symbol layer.optionaltoggleToolOnClick BooleanDefault Value:trueIndicates if the graphic being updated can be toggled between
transformandreshapeupdate options.
When
true, this property indicates whether the widget has been destroyed.
- iconClass String
The Sketch widget's default CSS icon class.
The unique ID assigned to the widget when the widget is created. If not set by the developer, it will default to the container ID, or if that is not present then it will be automatically generated.
- label String
The Sketch widget's default label.
- layer GraphicsLayer
The GraphicsLayer associated with the Sketch widget. The Sketch widget adds new graphics to this layer or can only update graphics stored in this layer.
- layout String
Determines the layout/orientation of the Sketch widget.
Possible Values:"vertical"|"horizontal"
- Default Value:horizontal
- state Stringreadonly
The Sketch widget's state.
Possible Values:"ready"|"disabled"|"active"
- updateGraphics Collection<Graphic>readonly
An array of graphics that are being updated by the Sketch widget.
- viewModel SketchViewModel
The view model for the Sketch widget. This is a class that contains all the logic (properties and methods) that controls this widget's behavior. See the SketchViewModel class to access all properties and methods on the Sketch widget.
Method Overview
| Name | Return Type | Summary | Class | |
|---|---|---|---|---|
Cancels the active operation and fires the create or update event and changes the event's state to | more details | Sketch | ||
| String | A utility method used for building the value for a widget's | more details | Widget | |
Completes the active operation and fires the create or update event and changes the event's state to | more details | Sketch | ||
Create a graphic with the geometry specified in the | more details | Sketch | ||
Deletes the selected graphics used in the update workflow. more details | more details | Sketch | ||
Destroys the widget instance. more details | more details | Widget | ||
| Boolean | Emits an event on the instance. more details | more details | Widget | |
| Boolean | Indicates whether there is an event listener on the instance that matches the provided event name. more details | more details | Widget | |
| Object | Registers an event handler on the instance. more details | more details | Widget | |
Widget teardown helper. more details | more details | Widget | ||
This method is primarily used by developers when implementing custom widgets. more details | more details | Widget | ||
Incrementally redo actions recorded in the stack. more details | more details | Sketch | ||
| Object | This method is primarily used by developers when implementing custom widgets. more details | more details | Widget | |
Renders widget to the DOM immediately. more details | more details | Widget | ||
This method is primarily used by developers when implementing custom widgets. more details | more details | Widget | ||
Incrementally undo actions recorded in the stack. more details | more details | Sketch | ||
| Promise<void> | Initializes an update operation for the specified graphic(s) and fires update event. more details | more details | Sketch |
Method Details
- cancel()
Cancels the active operation and fires the create or update event and changes the event's state to
cancel. If called in the middle of a create operation,cancel()discards the partially created graphic.
A utility method used for building the value for a widget's
classproperty. This aids in simplifying CSS class setup.Parameter:repeatable The class names.
Returns:Type Description String The computed class name. Example:// .tsx syntax showing how to set CSS classes while rendering the widget render() { const dynamicIconClasses = { [CSS.myIcon]: this.showIcon, [CSS.greyIcon]: !this.showIcon }; return ( <div class={classes(CSS.root, CSS.mixin, dynamicIconClasses)} /> ); }
- complete()
Completes the active operation and fires the create or update event and changes the event's state to
complete. If called in the middle of a create operation,complete()finishes the active create operation and keeps the valid geometry.
- create(tool, createOptions)
Create a graphic with the geometry specified in the
toolparameter. When the first vertex of the graphic is added, the create event will start firing. The providedtoolwill become the activeTool.Parameters:tool StringName of the create tool. Specifies the geometry for the graphic to be created.
Possible Values:"point"|"polyline"|"polygon"|"rectangle"|"circle"
createOptions ObjectoptionalOptions for the graphic to be created.
Specification:mode StringoptionalSpecifies how the graphic can be created. The create mode applies only when creating
polygon,polyline,rectangleandcirclegeometries.Possible Values:
Value Description hybrid Vertices are added while the pointer is clicked or dragged. Applies to and is the default for polygonandpolyline.freehand Vertices are added while the pointer is dragged. Applies to polygon,polylinerectangleandcircle. Default forrectangleandcircle.click Vertices are added when the pointer is clicked. Possible Values:"hybrid"|"freehand"|"click"
Example:// Call create method to create a polygon with freehand mode. sketch.create("polygon", { mode: "freehand" }); // listen to create event, only respond when event's state changes to complete sketch.on("create", function(event) { if (event.state === "complete") { // remove the graphic from the layer associated with the Sketch widget // instead use the polygon that user created to query features that // intersect it. polygonGraphicsLayer.remove(event.graphic); selectFeatures(event.graphic.geometry); } });
- delete()Since: ArcGIS API for JavaScript 4.14
Deletes the selected graphics used in the update workflow. Calling this method will fire the delete event.
- destroy()inherited
Destroys the widget instance.
Emits an event on the instance. This method should only be used when creating subclasses of this class.
Parameters:type StringThe name of the event.
event ObjectoptionalThe event payload.
Returns:Type Description Boolean trueif a listener was notified
Indicates whether there is an event listener on the instance that matches the provided event name.
Parameter:type StringThe name of the event.
Returns:Type Description Boolean Returns true if the class supports the input event.
Registers an event handler on the instance. Call this method to hook an event with a listener.
Parameters:A event type, or an array of event types, to listen for.
listener FunctionThe function to call when the event is fired.
Returns:Type Description Object Returns an event handler with a remove()method that can be called to stop listening for the event(s).Property Type Description remove Function When called, removes the listener from the event. Example:view.on("click", function(event){ // event is the event handle returned after the event fires. console.log(event.mapPoint); });
- own(handles)inherited
Widget teardown helper. Any handles added to it will be automatically removed when the widget is destroyed.
Parameter:handles WatchHandle|WatchHandle[]Handles marked for removal once the widget is destroyed.
- postInitialize()inherited
This method is primarily used by developers when implementing custom widgets. Executes after widget is ready for rendering.
- redo()
Incrementally redo actions recorded in the stack. Calling this method will fire the redo event.
This method is primarily used by developers when implementing custom widgets. It must be implemented by subclasses for rendering.
Returns:Type Description Object The rendered virtual node.
- renderNow()inherited
Renders widget to the DOM immediately.
- scheduleRender()inherited
This method is primarily used by developers when implementing custom widgets. Schedules widget rendering. This method is useful for changes affecting the UI.
- undo()
Incrementally undo actions recorded in the stack. Calling this method will fire the undo event.
- update(graphics, updateOptions){Promise<void>}
Initializes an update operation for the specified graphic(s) and fires update event.
Parameters:Specification:A graphic or an array of graphics to be updated. Only graphics added to SketchViewModel's layer property can be updated.
updateOptions ObjectoptionalUpdate options for the graphics to be updated.
Specification:tool StringoptionalName of the update tool. Specifies the update operation for the selected graphics. The provided tool will become the activeTool.
Possible Values:
Value Description transform This is the default tool for graphics with a polygon geometry, polyline geometry or graphics that use a 3D object symbol layer with a point geometry. It allows one or multiple graphics to be scaled, rotated and moved by default. Its default behavior can be changed by setting the enableRotation,enableScalingorpreserveAspectRatioarguments when calling theupdatemethod or setting them on the defaultUpdateOptions property when the Sketch widget initializes.reshape This tool allows the entire graphic or individual vertices of the graphic to be moved. Vertices can be added or removed. This tool can only be used with a single graphic that has a polygon or polyline geometry. move This is the default tool for graphics with a point geometry that do not use a 3D object symbol layer. It should be used for specific cases where you just want to move selected polygonandpolylinegraphics without additional options. Additionally, themovetool does not support toggling to different modes, since themoveoperation is built into both thetransformandreshapetools by default.Possible Values:"transform"|"reshape"|"move"
enableRotation BooleanoptionalDefault Value: trueIndicates if the
rotationoperation will be enabled when updating graphics. Only applies iftoolistransform.enableScaling BooleanoptionalDefault Value: trueIndicates if the
scaleoperation will be enabled when updating graphics. Only applies iftoolistransform.preserveAspectRatio BooleanoptionalDefault Value: falseIndicates if the uniform scale operation will be enabled when updating graphics.
enableScalingmust be settruewhen setting this property totrue. Only applies iftoolistransformand is alwaystruewhen transforming points that use a 3D object symbol layer.toggleToolOnClick BooleanoptionalDefault Value: trueIndicates if the graphic being updated can be toggled between
transformandreshapeupdate options.Returns:Type Description Promise<void> Resolves when the requested update tool has been loaded and is ready to use. Examples:// start update operation for the selected graphic // with transform tool. Only allow uniform scaling operation. sketch.update([selectedGraphic], { tool: "transform", enableRotation: false, enableScaling: true, preserveAspectRatio: true, toggleToolOnClick: false });// Listen to sketch's update event to validate graphic's // location while it is being reshaped or moved sketch.on("update", onGraphicUpdate); function onGraphicUpdate(event) { // get the graphic as it is being updated const graphic = event.graphics[0]; // check if the graphic is intersecting school buffers intersects = geometryEngine.intersects(buffers, graphic.geometry); // change the graphic symbol to valid or invalid symbol // depending the graphic location graphic.symbol = (intersects) ? invalidSymbol : validSymbol // check if the update event's the toolEventInfo.type is move-stop or reshape-stop // user finished moving or reshaping the graphic, call complete method. // This changes update event state to complete. const toolType = event.toolEventInfo.type; if (event.toolEventInfo && (toolType === "move-stop" || toolType === "reshape-stop")) { if (!intersects) { sketch.complete(); } } else if ((event.state === "cancel" || event.state === "complete")) { // graphic update has been completed or cancelled // if the graphic is in a bad spot, call sketch's update method again // giving user a chance to correct the location of the graphic if ((!contains) || (intersects)) { sketch.update({ tool: "reshape", graphics: [graphic], toggleToolOnClick: false }); } } }
Type Definitions
- CreateToolEventInfo |
This information is returned as
toolEventInfoparameter for the create event when the graphic is being created. It returns VertexAddEventInfo when the user clicks the view or CursorUpdateEventInfo or when the user moves the cursor.
- CursorUpdateEventInfo Object
This information is returned as
toolEventInfoparameter for the create event when the user moves the cursor on the view while the graphic is being created.- Properties:
- type String
Type is always
cursor-update.The value is always "cursor-update".
An array of numbers representing the coordinates of the cursor location.
Example:// listen to create event sketch.on("create", function(event){ // respond to create event while the cursor is being moved on the view. const eventInfo = event.toolEventInfo; if (eventInfo && eventInfo.type === "cursor-update"){ console.log(eventInfo.type, eventInfo.coordinates[0], eventInfo.coordinates[1]); } });
- MoveEventInfo Object
This information is returned as
toolEventInfoparameter for the update event while the user is moving the graphics. It returns additional information associated with the move operation and what stage it is at.- Properties:
- type String
Returns information indicating the stage of the move operation.
Possible Values:
Value Description move-start The type changes to move-startat the start ofmoveoperation.move The type changes to movewhile graphics are being moved.move-stop The type changes to move-stoponce graphics are moved.Possible Values:"move-start"|"move"|"move-stop"
dx NumberNumber of pixels moved on the x-axis from the last known position.
dy NumberNumber of pixels moved on the y-axis from the last known position.
mover GraphicThe instance of the graphic that is being moved.
Example:// listen to update event sketch.on("update", function(event){ // check if the graphics are done being moved, printout dx, dy parameters to the console. const eventInfo = event.toolEventInfo; if (eventInfo && eventInfo.type.includes("move")){ console.log(eventInfo.type, eventInfo.dx, eventInfo.dy); } });
- ReshapeEventInfo Object
This information is returned as
toolEventInfoparameter for the update event while the user is reshaping the graphics. It returns additional information associated with the reshape operation and what stage it is at.- Property:
- type String
Returns information indicating the stage of the reshape operation.
Possible Values:
Value Description reshape-start The type changes to reshape-startat the start ofreshapeoperation.reshape The type changes to reshapewhile graphics are being reshaped.reshape-stop The type changes to reshape-stoponce graphics are reshaped.Possible Values:"reshape-start"|"reshape"|"reshape-stop"
Example:// listen to update event sketch.on("update", function(event){ // check if the graphics are done being reshaped, printout updated graphic's geometry and reshape stage. const eventInfo = event.toolEventInfo; if (eventInfo && eventInfo.type.includes("reshape")) { console.log(eventInfo.type, event.graphics[0].geometry); } });
- RotateEventInfo Object
This information is returned as
toolEventInfoparameter for the update event while the user is rotating the graphics. It returns additional information associated with the rotate operation and what stage it is at.- Properties:
- type String
Returns information indicating the stage of the rotate operation.
Possible Values:
Value Description rotate-start The type changes to rotate-startat the start ofrotateoperation.rotate The type changes to rotatewhile graphics are being rotated.rotate-stop The type changes to rotate-stoponce graphics are rotated.Possible Values:"rotate-start"|"rotate"|"rotate-stop"
angle NumberAngle of rotation in degrees.
Example:// listen to update event sketch.on("update", function(event){ if (evt.tool === "transform") { if (event.toolEventInfo) { const info = evt.toolEventInfo, type = info.type; // rotate events only if (type.includes("rotate")) { // check if the rotation angle exceeded 45 if (info.angle > 45) { // complete the graphic update operation sketch.complete(); } } } } });
- ScaleEventInfo Object
This information is returned as
toolEventInfoparameter for the update event while the user is scaling or resizing the graphics. It returns additional information associated with the scale operation and what stage it is at.- Properties:
- type String
Returns information indicating the stage of the scale operation.
Possible Values:
Value Description scale-start The type changes to scale-startat the start of scale or resize operation.scale The type changes to scalewhile graphics are being scaled or resized.scale-stop The type changes to scale-stoponce graphics are scaled or resized.Possible Values:"scale-start"|"scale"|"scale-stop"
xScale NumberThe x scale factor used to enlarge or shrink the geometry.
yScale NumberThe y scale factor used to enlarge or shrink the geometry.
- UpdateToolEventInfo |||||
This information is returned as
toolEventInfoparameter for the update event when the user is updating graphics.
- VertexAddEventInfo Object
This information is returned as
toolEventInfoparameter for the create or update event when the user adds vertices to the graphic being created or updated.- Properties:
- type String
Type is always
vertex-add.The value is always "vertex-add".
An array of graphics with point geometries representing the vertices that were added.
Example:// listen to create event sketch.on("create", function(event){ // check if vertices are being added to the graphic that is being updated. if (event.toolEventInfo && event.toolEventInfo.type === "vertex-add"){ const addedPoint = event.toolEventInfo.added[0].geometry; console.log(event.toolEventInfo.type, addedPoint.x, addedPoint.y); } });
- VertexRemoveEventInfo Object
This information is returned as
toolEventInfoparameter for the update event when the user is removing vertices from the graphic.- Properties:
- type String
Type is always
vertex-remove.The value is always "vertex-remove".
An array of graphics with point geometries representing the vertices that were removed.
Example:// listen to update event sketch.on("update", function(event){ // check if vertices are being added to the graphic that is being updated. const eventInfo = event.toolEventInfo; if (eventInfo && eventInfo.type === "vertex-remove"){ const removedPoint = eventInfo.removed[0].geometry; console.log(eventInfo.type, removedPoint.x,removedPoint.y); } });
Event Overview
| Name | Type | Summary | Class | |
|---|---|---|---|---|
{graphic: Graphic,state: "start","active","complete","cancel",tool: "point","polyline","polygon","rectangle","circle",toolEventInfo: CreateToolEventInfo,type: "create"} | Fires when a user starts sketching a graphic, is actively sketching a graphic and completes sketching a graphic. more details | more details | Sketch | |
{graphics: Graphic[],tool: "move","reshape","transform",type: "delete"} | Fires when a user deletes selected graphics by clicking the | more details | Sketch | |
{graphics: Graphic[],tool: "point","polyline","polygon","rectangle","circle","move","transform","reshape",type: "redo"} | Fires in response to redo action during creation of a new graphic or updating existing graphics. more details | more details | Sketch | |
{graphics: Graphic[],tool: "point","polyline","polygon","rectangle","circle","move","transform","reshape",type: "undo"} | Fires in response to undo action during creation of a new graphic or updating existing graphics. more details | more details | Sketch | |
{graphics: Graphic[],state: "start","active","complete","cancel",tool: "move","transform","reshape",type: "update",toolEventInfo: UpdateToolEventInfo} | Fires when the user starts updating graphics, is actively updating graphics, and completes updating graphics. more details | more details | Sketch |
Event Details
- create
Fires when a user starts sketching a graphic, is actively sketching a graphic and completes sketching a graphic.
- Properties:
- graphic Graphic
The graphic that is being created.
state StringThe current state of the event.
Possible Values:
Value Description start State changes to startwhen the first vertex is created. Not applicable when creatingpoints.active State is activewhile graphic is being created. Not applicable when creatingpoints.complete State changes to completeafter the complete() method is called, when the user double clicks, presses the C key or clicks the first vertex of thepolygonwhile creating a graphic. Whenpointis created, the create event is fired with thecompletestate.cancel State changes to cancelif the create() or cancel() methods are called during the create operation and before the state changes tocomplete.Possible Values:"start"|"active"|"complete"|"cancel"
tool StringName of the create tool.
Possible Values:"point"|"polyline"|"polygon"|"rectangle"|"circle"
toolEventInfo CreateToolEventInfoReturns additional information associated with the create operation such as where the user is clicking the view or where the user is moving the cursor to. Value of this parameter changes to
nullwhen thecreateevent'sstatechanges tocompleteorcancel.type StringThe type of the event.
The value is always "create".
Example:// Listen to sketch widget's create event. sketch.on("create", function(event) { // check if the create event's state has changed to complete indicating // the graphic create operation is completed. if (event.state === "complete") { // remove the graphic from the layer. Sketch adds // the completed graphic to the layer by default. polygonGraphicsLayer.remove(event.graphic); // use the graphic.geometry to query features that intersect it selectFeatures(event.graphic.geometry); } });
- deleteSince: ArcGIS API for JavaScript 4.14
Fires when a user deletes selected graphics by clicking the
Delete featurebutton on the Sketch widget or when delete() method is called.- Properties:
An array of deleted graphics.
tool StringName of the tool that was active when graphics are deleted.
Possible Values:"move"|"reshape"|"transform"
type StringThe type of the event.
The value is always "delete".
Example:// selected graphics can be deleted only when update event becomes active sketch.on("update", function(event) { if (event.state === "active") { sketch.delete(); } }); // fires after delete method is called // returns references to deleted graphics. sketch.on("delete", function(event) { event.graphics.forEach(function(graphic){ console.log("deleted", graphic) }); });
- redo
Fires in response to redo action during creation of a new graphic or updating existing graphics.
- Properties:
An array of graphics that are being updated or created.
tool StringName of the create or update tool that is active.
Possible Values:"point"|"polyline"|"polygon"|"rectangle"|"circle"|"move"|"transform"|"reshape"
type StringThe type of the event.
The value is always "redo".
- undo
Fires in response to undo action during creation of a new graphic or updating existing graphics.
- Properties:
An array of graphics that are being updated or created.
tool StringName of the create or update tool that is active.
Possible Values:"point"|"polyline"|"polygon"|"rectangle"|"circle"|"move"|"transform"|"reshape"
type StringThe type of the event.
The value is always "undo".
- update
Fires when the user starts updating graphics, is actively updating graphics, and completes updating graphics.
- Properties:
An array of graphics that are being updated.
state StringThe state of the event.
Possible Values:
Value Description start State changes to startwhen a graphic is selected to be updated.active State is activewhile graphics are being updated andtoolEventInfoparameter is notnull.complete State changes to completeafter graphics are updated.cancel State changes to cancelwhen graphics are selected and then unselected without any updates, or when the update(), create() or cancel() method is called before theupdateevent'sstatechanges tocomplete.Possible Values:"start"|"active"|"complete"|"cancel"
tool StringName of the update operation tool.
Possible Values:"move"|"transform"|"reshape"
type StringThe type of the event.
The value is always "update".
toolEventInfo UpdateToolEventInfoReturns additional information associated with the update operation that is taking place for the selected graphics and what stage it is at. Value of this parameter changes to
nullwhen theupdateevent'sstatechanges tocomplete.
Example:// Listen to sketch's update event to show relevant data in a chart // as the graphics are being moved sketch.on("update", onMove); // Point graphics at the center and edge of the buffer polygon are being moved. // Recalculate the buffer with updated geometry and run the query stats using // the updated buffer and update the chart. function onMove(event) { // If the edge graphic is moving, keep the center graphic // at its initial location. Only move edge graphic to resize the buffer. if (event.toolEventInfo && event.toolEventInfo.mover.attributes.edge) { const toolType = event.toolEventInfo.type; if (toolType === "move-start") { centerGeometryAtStart = centerGraphic.geometry; } // keep the center graphic at its initial location when edge point is moving else if (toolType === "move" || toolType === "move-stop") { centerGraphic.geometry = centerGeometryAtStart; } } // the center or edge graphic is being moved, recalculate the buffer const vertices = [ [centerGraphic.geometry.x, centerGraphic.geometry.y], [edgeGraphic.geometry.x, edgeGraphic.geometry.y] ]; // client-side stats query of features that intersect the buffer calculateBuffer(vertices); // user is clicking on the view... call update method with the center and edge graphics if ((event.state === "cancel" || event.state === "complete")) { sketch.update({ tool: "move", graphics: [edgeGraphic, centerGraphic] }); } }