Renderer
esri/renderers/RendererRenderers define how to visually represent each feature in one of the following layer types:
The Renderer object contains drawing information for the layer and is the base class for all renderers.
There are several types of renderers available for visualizing data. Each serves a different purpose, allowing you to explore your data and tell a visual story about it by combining geography and statistics. Most cartographic visualizations fall into one of the following categories.
| Visualization type | Renderer |
|---|---|
| Location only | SimpleRenderer, HeatmapRenderer |
| Unique (typed) values | UniqueValueRenderer |
| Class breaks | ClassBreaksRenderer |
| Continuous color/size | SimpleRenderer or UniqueValueRenderer with visualVariables |
| Multivariate | SimpleRenderer or UniqueValueRenderer with visualVariables |
Location
In many cases, the user just wants to see where a set of features are located. Some examples might be political boundaries, cities, buildings, rivers, etc. These are scenarios where you want all features in the layer to have the same symbol. To accomplish this you would use a SimpleRenderer.
The example in the screenshot below contains three layers; each uses a SimpleRenderer to assign all features the same symbol. The polygon layer represents states with no fill and a gray outline. The polyline layer visualizes highways with bright blue lines. The point layer depicts cities as marker symbols with the same bright blue color.
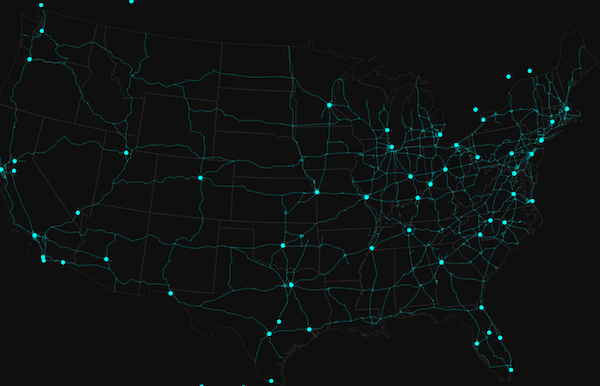
Read more on the SimpleRenderer page.
Unique types
UniqueValueRenderer allows you to symbolize features based on one or more matching string attribute values. Unique values are typically differentiated with colors, fill styles, or images to represent features of various types.
In the image below, each line is symbolized with a different color depending on the jurisdiction to which the highway belongs. For example, green lines are highways in the "Tampa District" whereas red lines are highways in the "Central District".
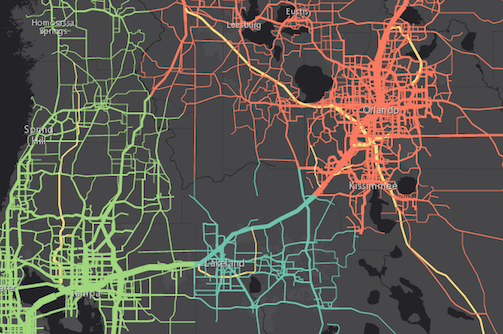
Read more on the UniqueValueRenderer page.
Class breaks
ClassBreaksRenderer sets the symbol of each feature in a layer based on the value of a numeric attribute. Symbols are assigned to classes, or ranges of data. Each feature is assigned a symbol based on the class in which the value of the attribute falls. In the example below, a FeatureLayer representing block groups is rendered with a ClassBreaksRenderer. Features where fewer than 35% of the population have a college degree are rendered with a deep green color. Features where between 35% and 50% of the population have a college degree are rendered with a pale green symbol. The other features are similarly rendered based on the value of the attribute of interest.
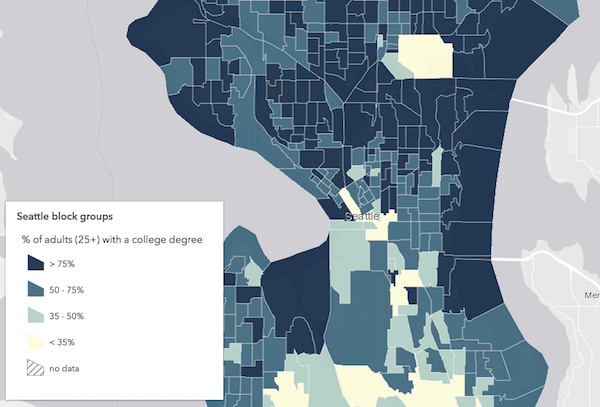
Read more on the ClassBreaksRenderer page.
Continuous ramps and multivariate visualizations
Rather than manually creating several class breaks to visualize numeric data, you can depict more variation in your layer using continuous styles. The color, size, opacity, and rotation visualVariables allow you to do this in either a SimpleRenderer, UniqueValueRenderer, or ClassBreaksRenderer.
The example below uses a UniqueValueRenderer with an opacity visual variable to map predominant types and the strength of their predominance in relation to other variables.
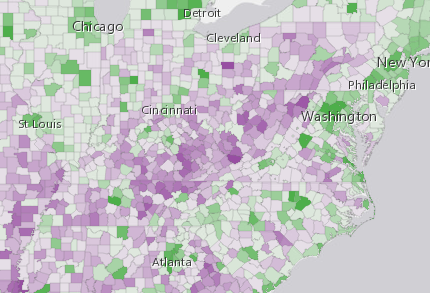
See visual variables for more information.
Property Overview
| Name | Type | Summary | Class | |
|---|---|---|---|---|
| AuthoringInfo | Authoring metadata only included in renderers generated from one of the Smart Mapping creator methods, such as sizeRendererCreator.createContinuousRenderer() or colorRendererCreator.createContinuousRenderer(). more details | more details | Renderer | |
| String | The name of the class. more details | more details | Accessor | |
| String | The renderer type. more details | more details | Renderer |
Property Details
- authoringInfo AuthoringInfoautocast
Authoring metadata only included in renderers generated from one of the Smart Mapping creator methods, such as sizeRendererCreator.createContinuousRenderer() or colorRendererCreator.createContinuousRenderer(). This includes information from UI elements such as sliders and selected classification methods and themes. This allows the authoring clients to save specific overridable settings so that next time it is accessed via the UI, their selections can be remembered.
- Since: ArcGIS API for JavaScript 4.7
The name of the class. The declared class name is formatted as
esri.folder.className.
- type Stringreadonly
The renderer type.
Possible values: class-breaks | heatmap | simple | unique-value | raster-stretch
Method Overview
| Name | Return Type | Summary | Class | |
|---|---|---|---|---|
| * | Creates a new instance of this class and initializes it with values from a JSON object generated from a product in the ArcGIS platform. more details | more details | Renderer | |
| Object | Converts an instance of this class to its ArcGIS portal JSON representation. more details | more details | Renderer |
Method Details
- fromJSON(json){*}static
Creates a new instance of this class and initializes it with values from a JSON object generated from a product in the ArcGIS platform. The object passed into the input
jsonparameter often comes from a response to a query operation in the REST API or a toJSON() method from another ArcGIS product. See the Using fromJSON() topic in the Guide for details and examples of when and how to use this function.Parameter:json ObjectA JSON representation of the instance in the ArcGIS format. See the ArcGIS REST API documentation for examples of the structure of various input JSON objects.
Returns:Type Description * Returns a new instance of this class.
- toJSON(){Object}
Converts an instance of this class to its ArcGIS portal JSON representation. See the Using fromJSON() topic in the Guide for more information.
Returns:Type Description Object The ArcGIS portal JSON representation of an instance of this class.