Note: this is a downloaded and locally hosted version of the documentation for ArcGIS API for JavaScript version 4.14. The most current documentation is available at js.arcgis.com.
Tutorials
Use tutorials to start building an app with the ArcGIS API for JavaScript.
Guide
Learn how to do mapping, geocoding, routing, and other spatial analytics.
Sample Code
Get code samples for mapping, visualization, and spatial analysis.
API Reference
Documentation for all ArcGIS API for JavaScript classes, methods, and properties.
Showcase
See how to combine functionality into interactive and compelling applications.
Visualize your data in 2D and 3D
- 3D visualization
- 2D visualization
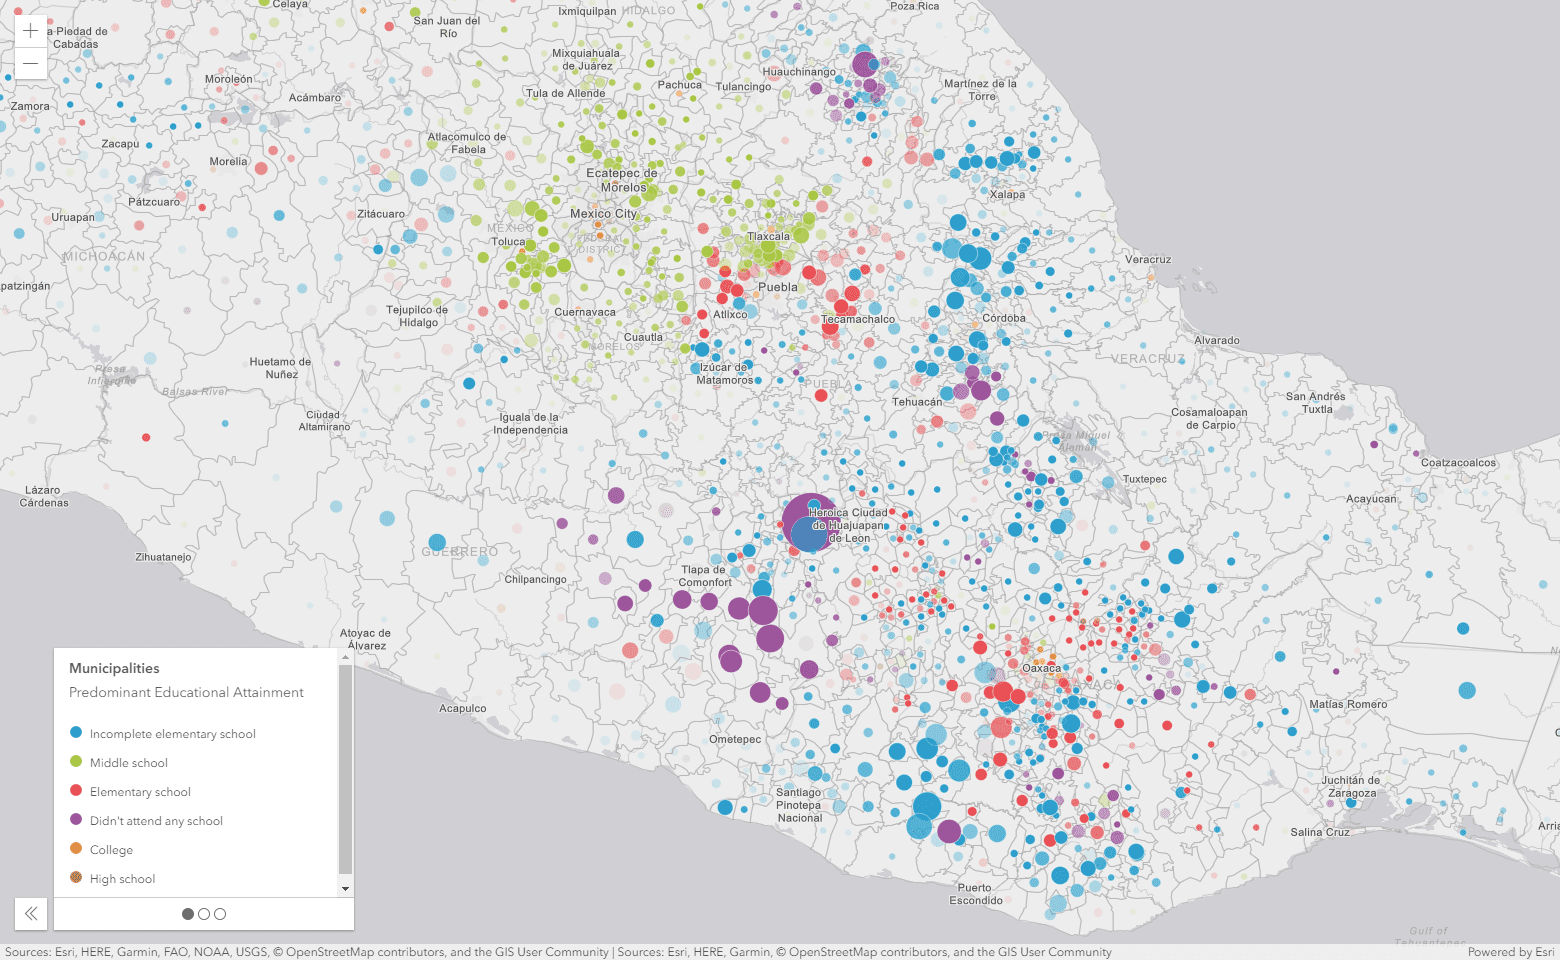
- Data-driven visualization
- Vector tiles
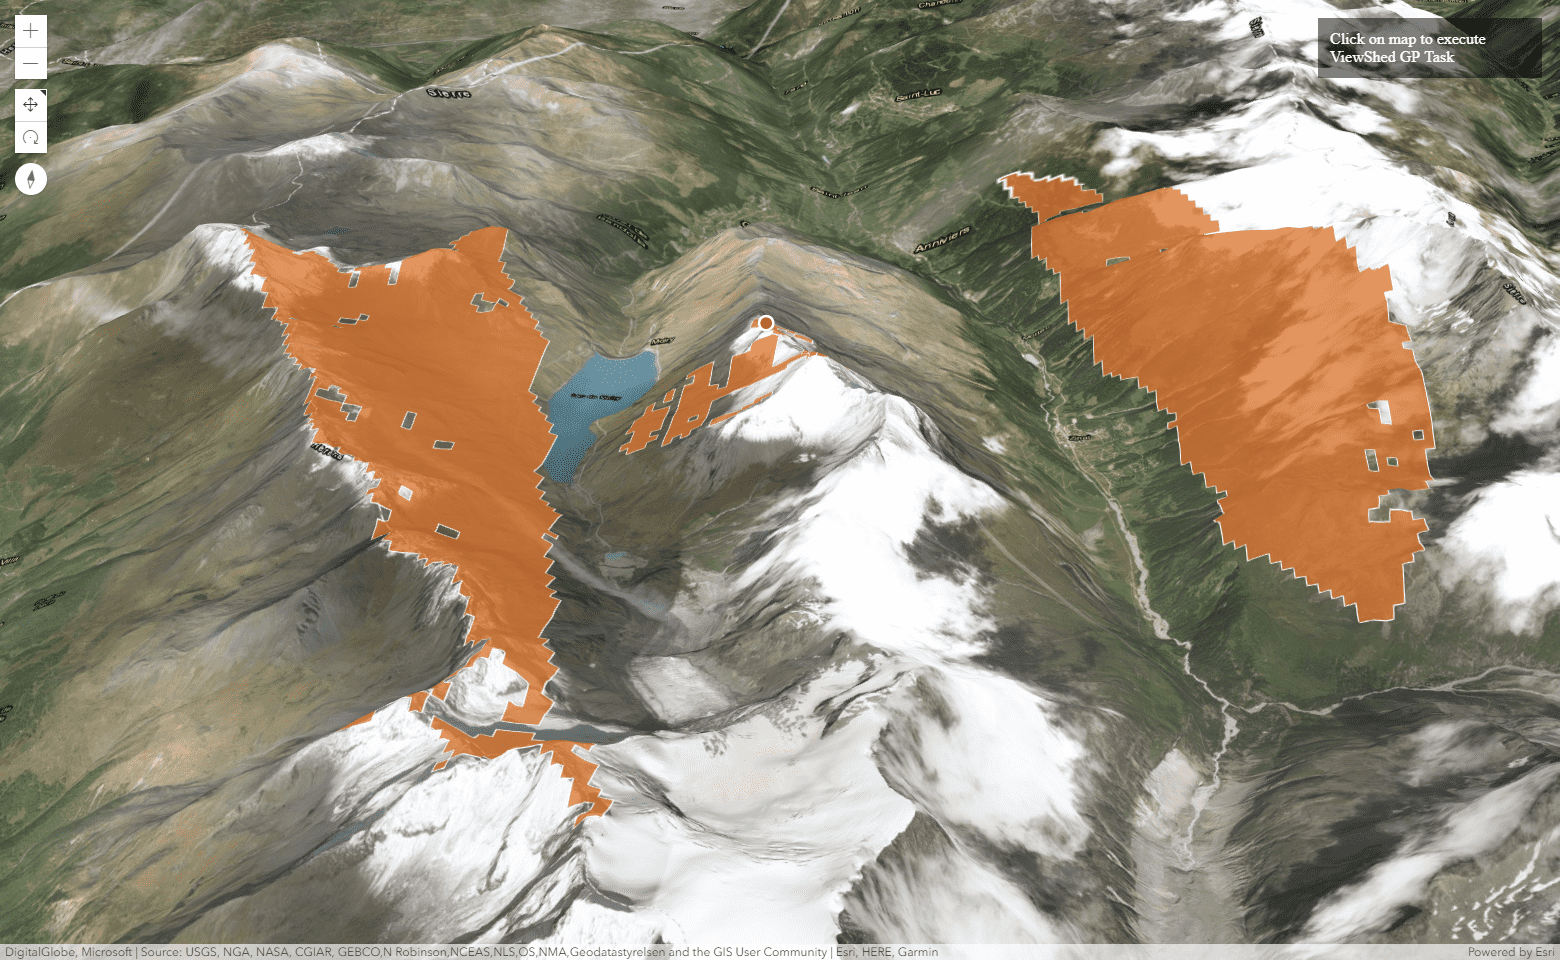
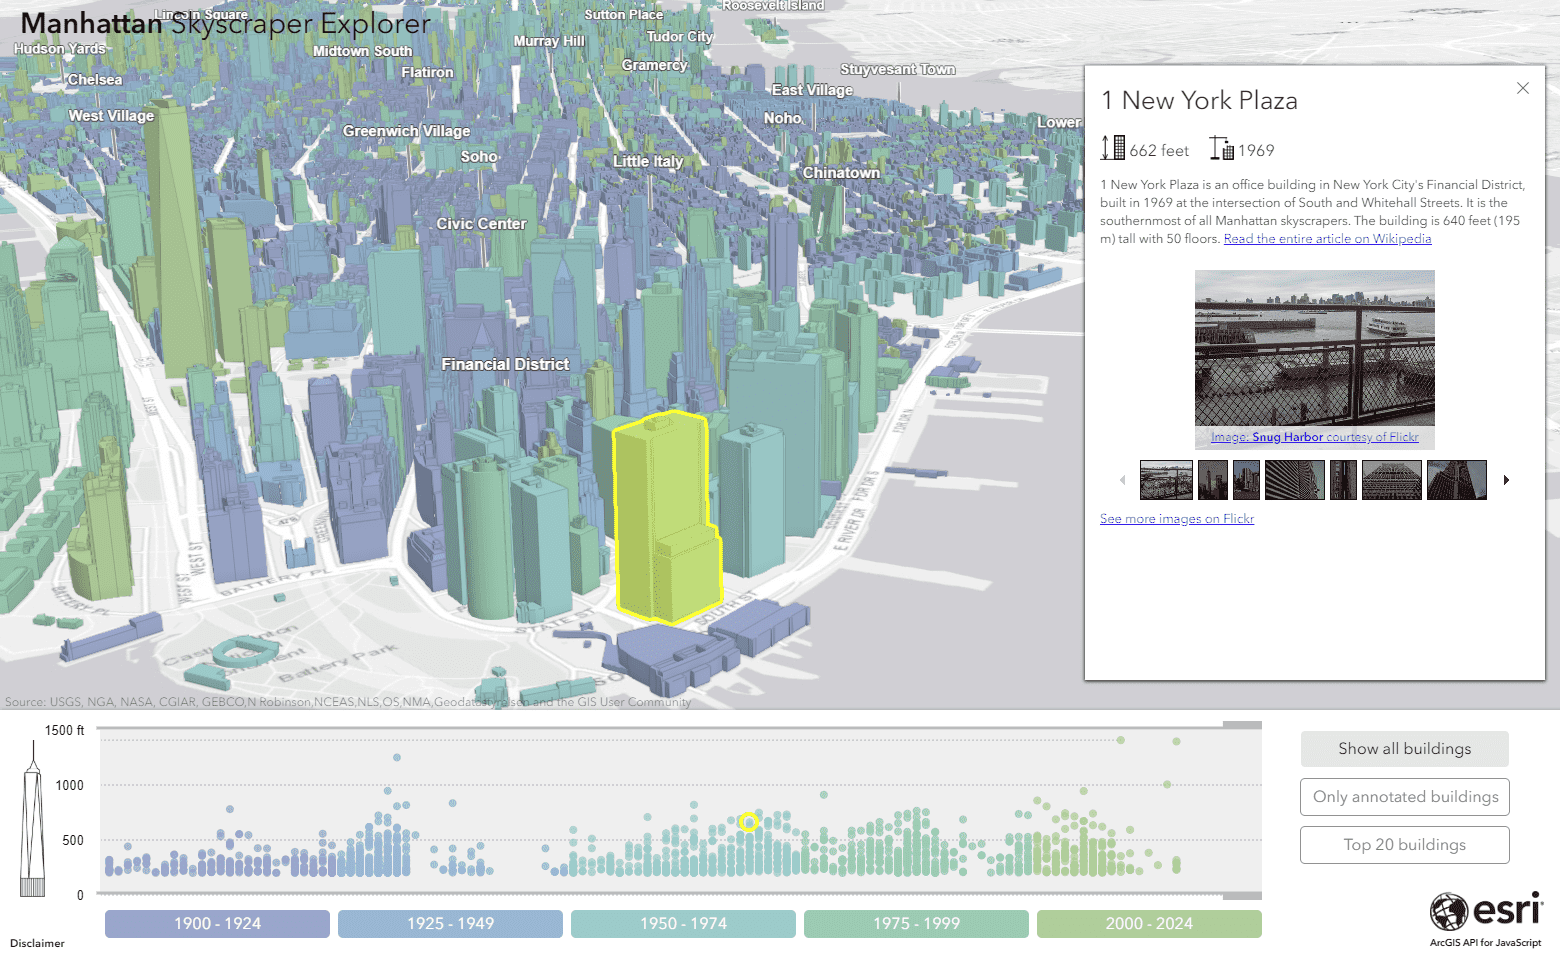
Create realistic urban landscapes, thematic 3D visualizations in a full 3D web experience.
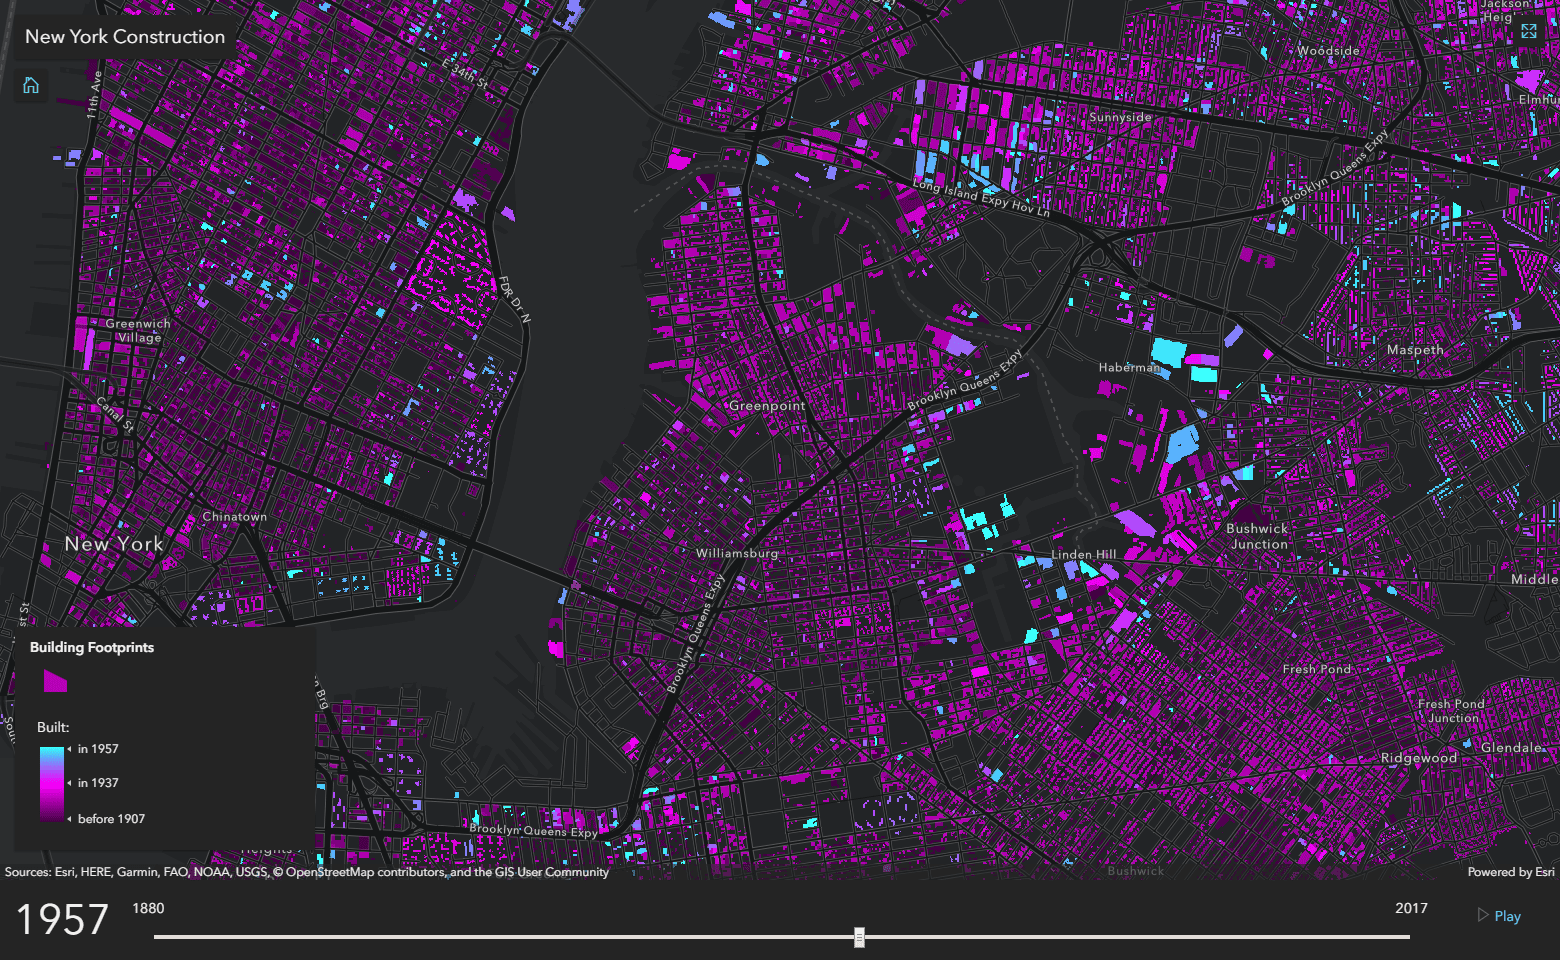
Create applications that can quickly visualize hundreds of thousands of features based on multiple variables.
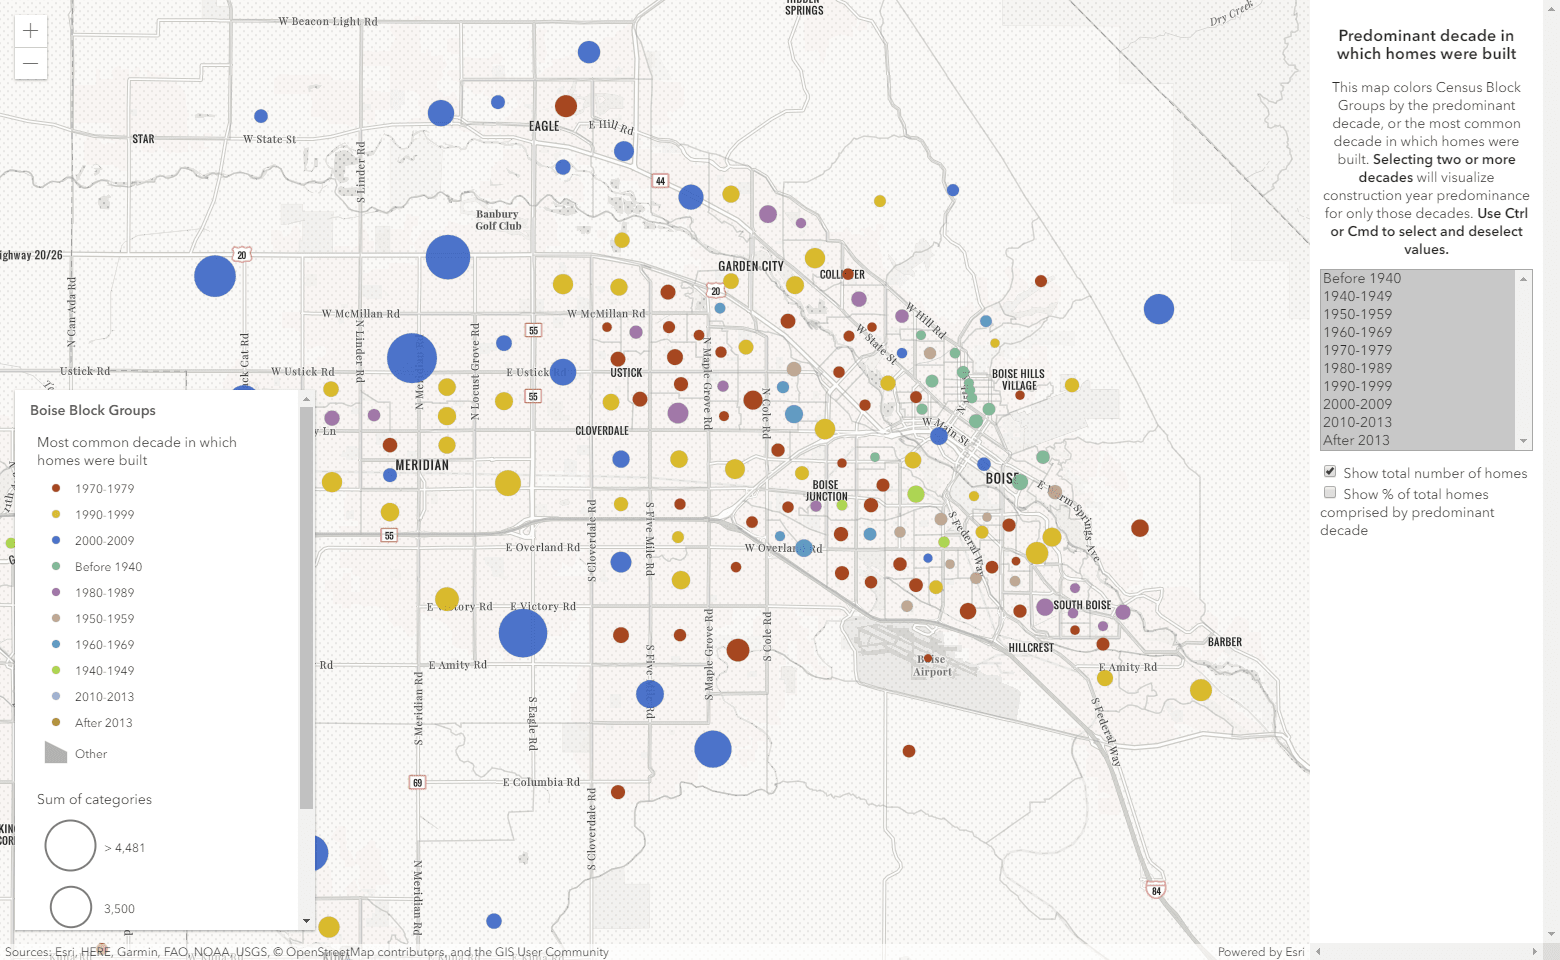
Let your data dynamically drive the styling of your layers with lightning performance.
Style Esri's basemaps using the vector tile style editor or dynamically in code.
Build compelling apps
- Client-side analysis
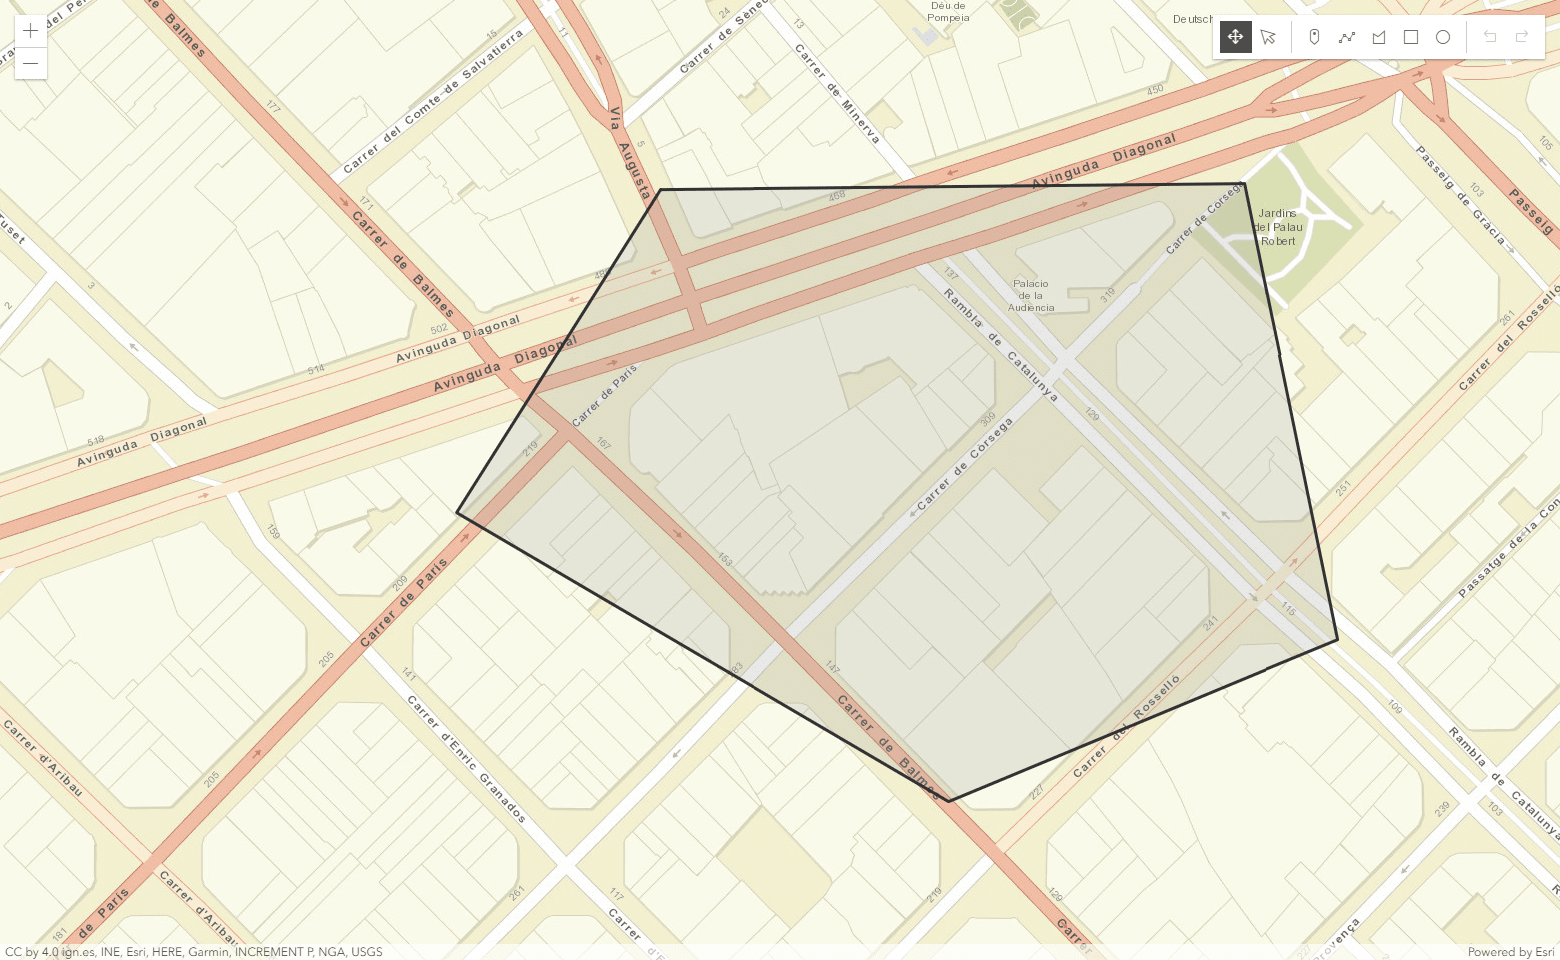
- Sketching
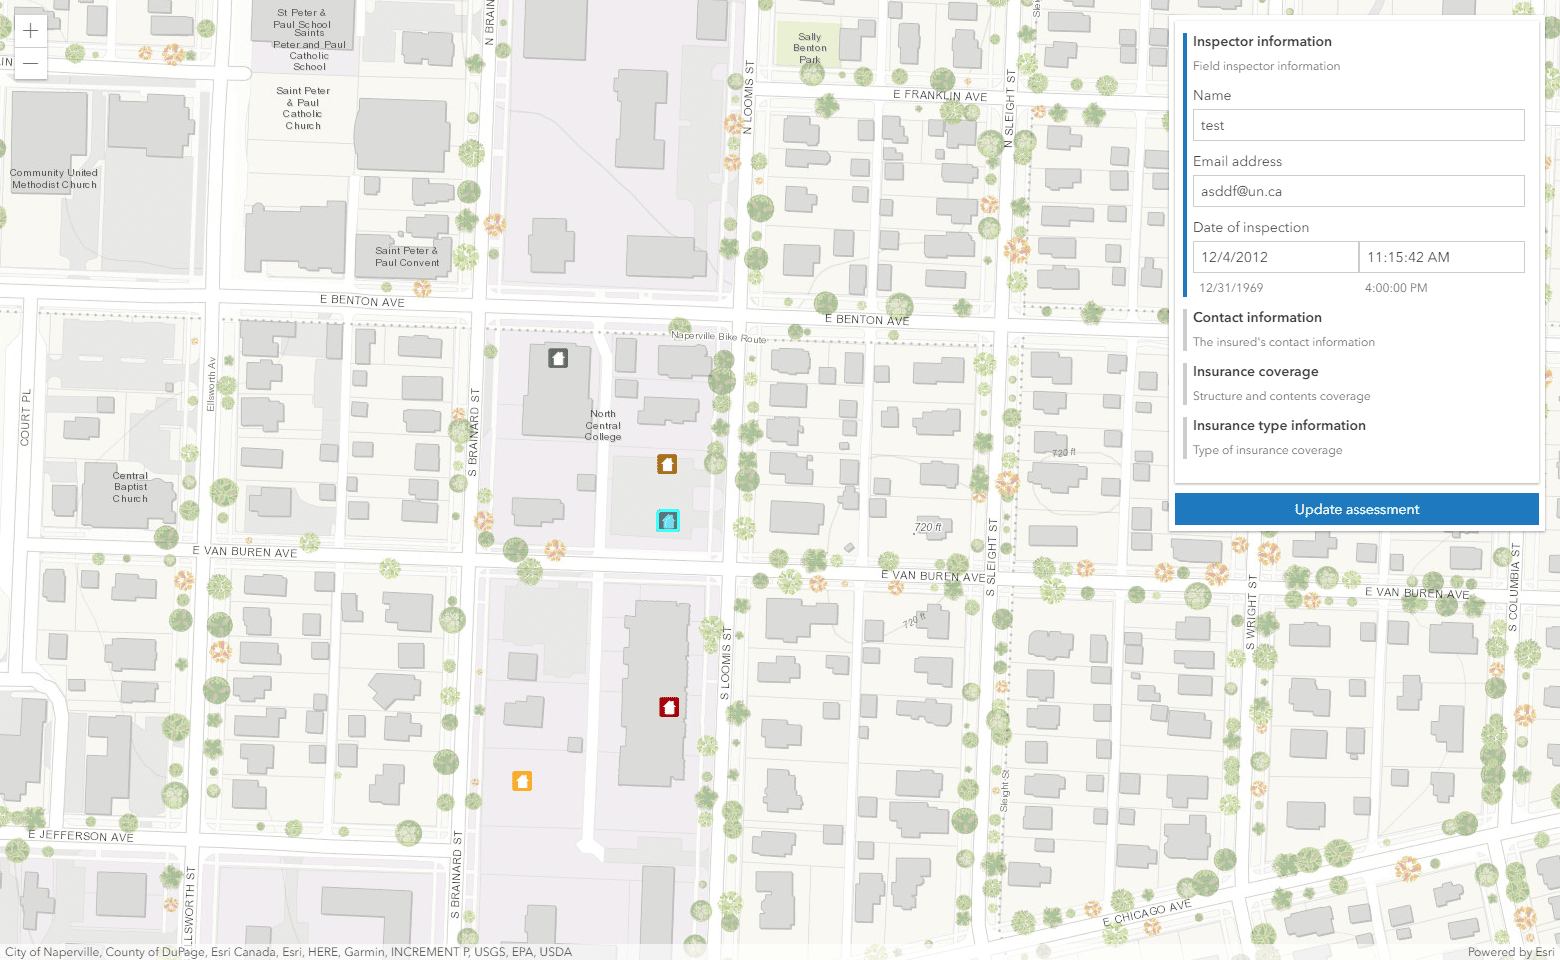
- Editing
- Responsive UI
- Widgets
- Geometric operations
Build interactive analytical apps using client-side querying, filtering, and statistics.
Enable your user to draw graphics on the map using the out of box sketch widget.
Edit data in the map that is directly tied to your database using the APIs editing tools.
Use the API to create an elegant user experience for any screen size.
Maximize your productivity by using slick API widgets to build your UI.
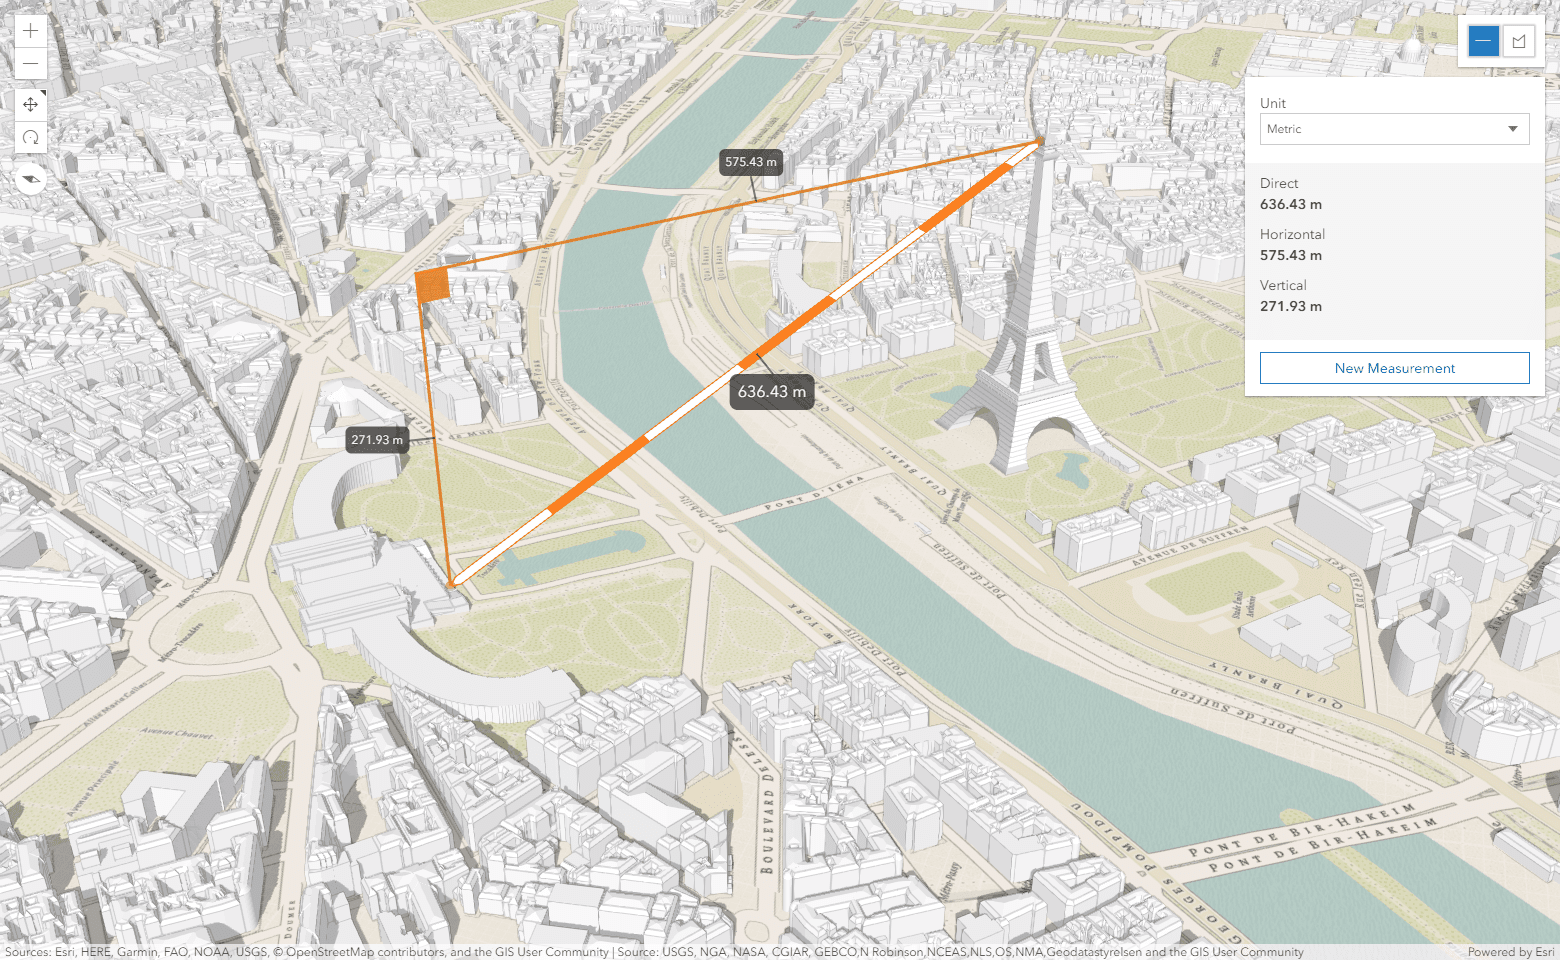
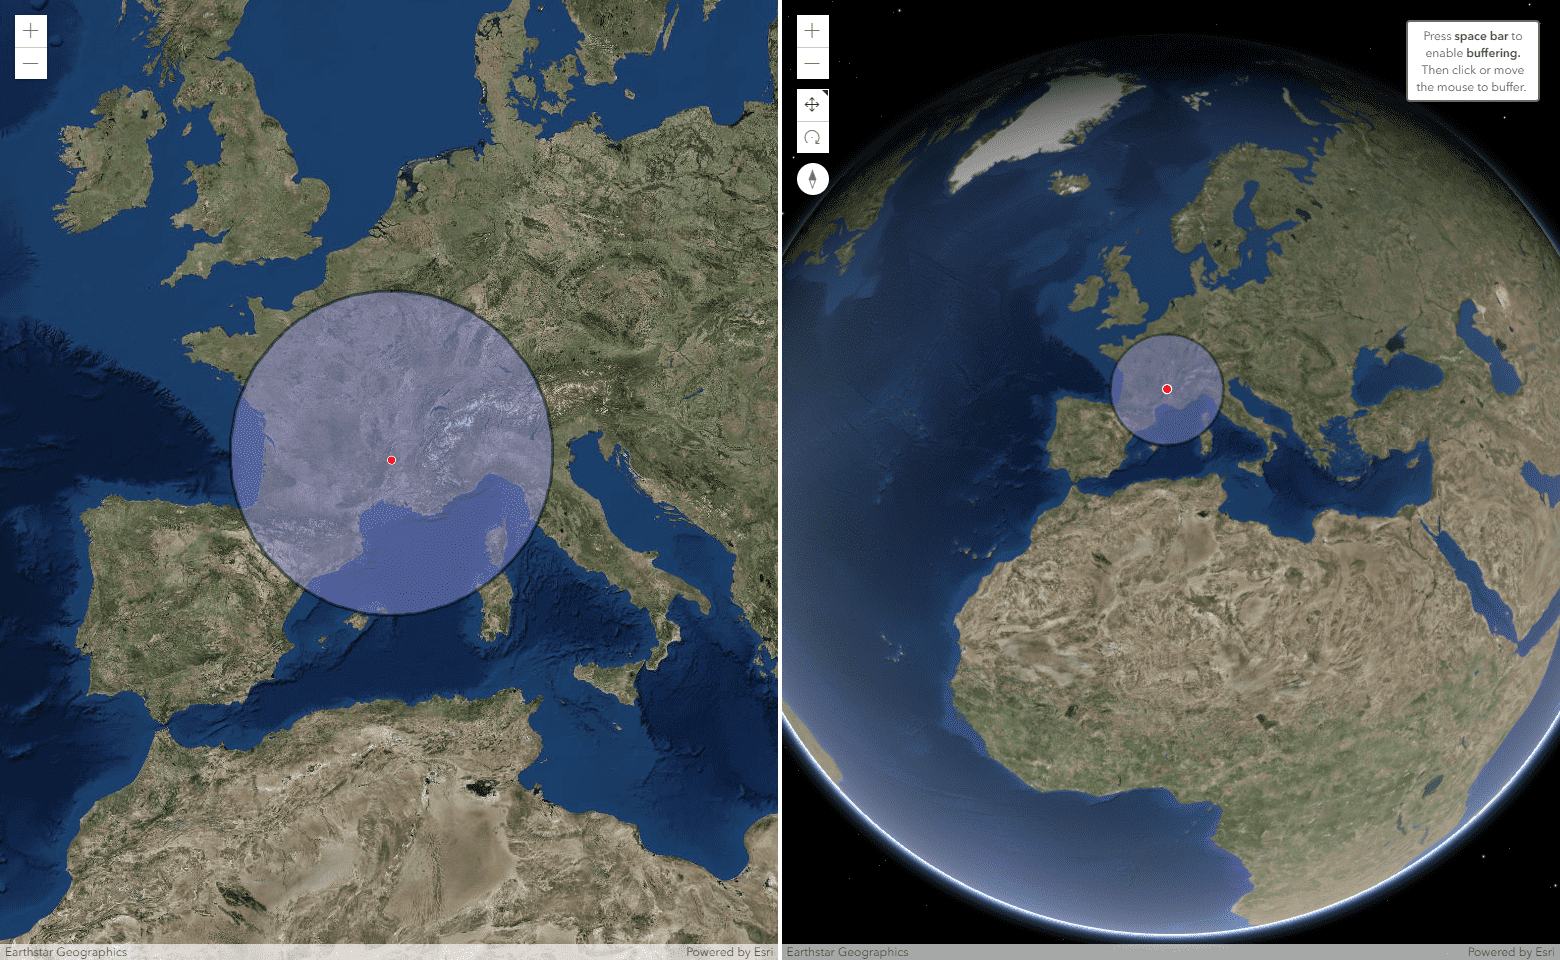
Perform client-side geometric operations such as buffer, intersect, and measurement
Gain insights with location intelligence
- Searching and Geocoding
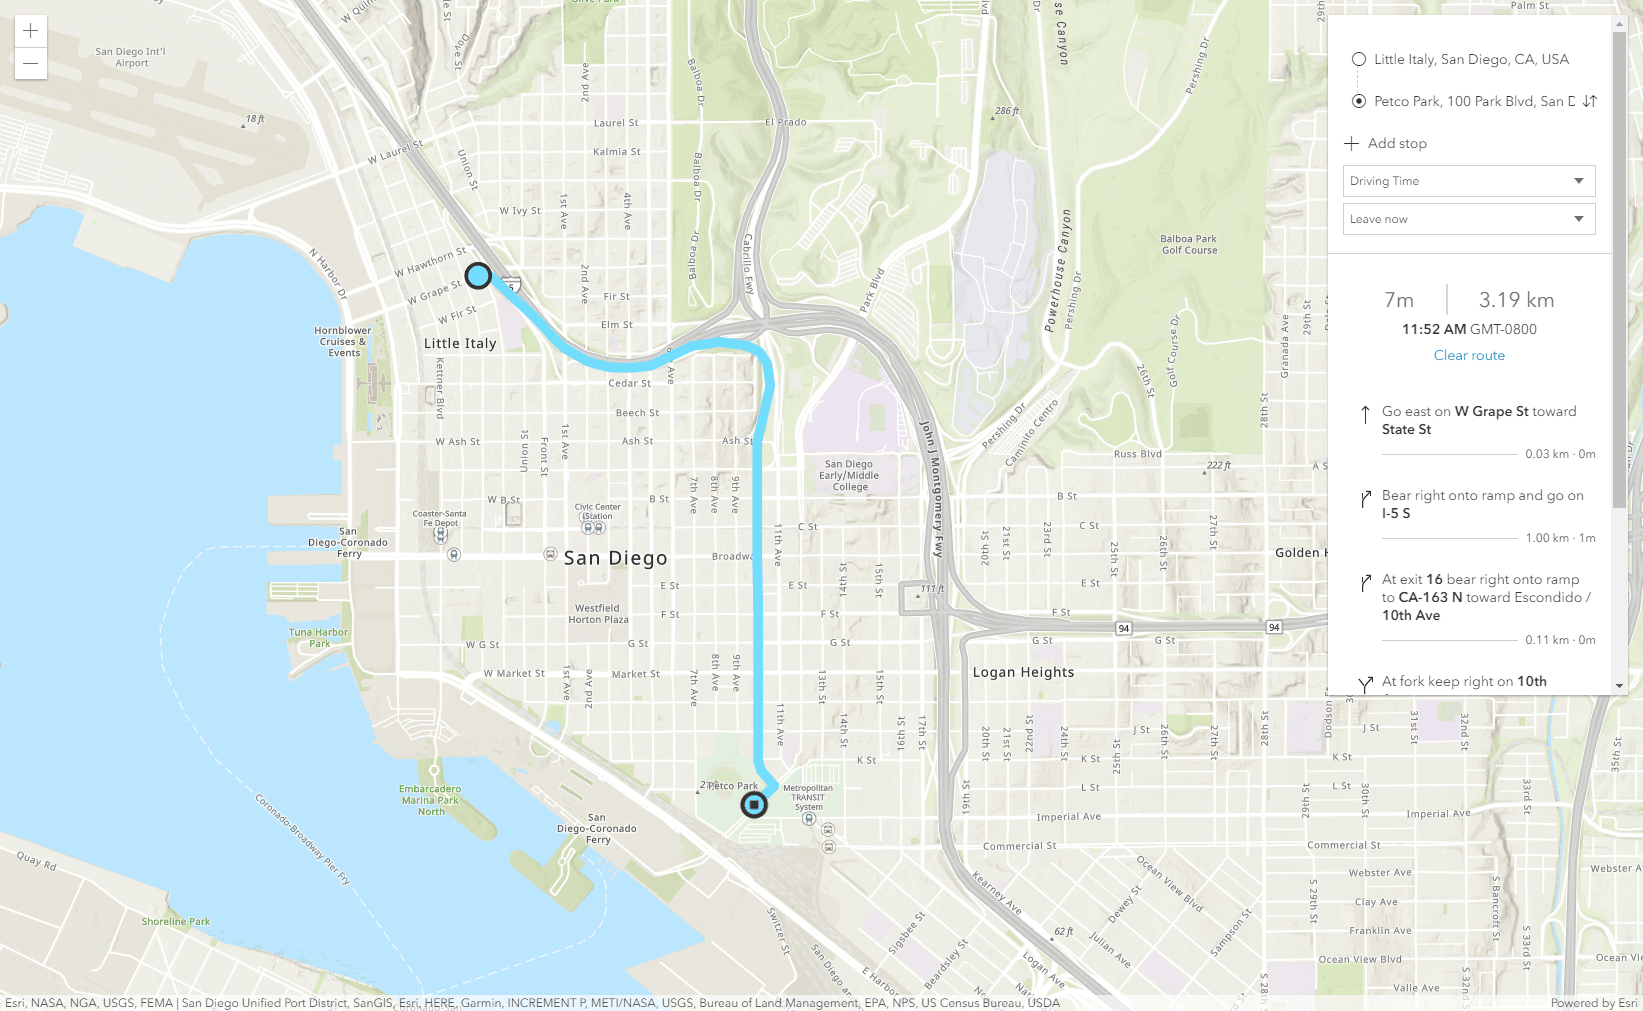
- Routing and directions
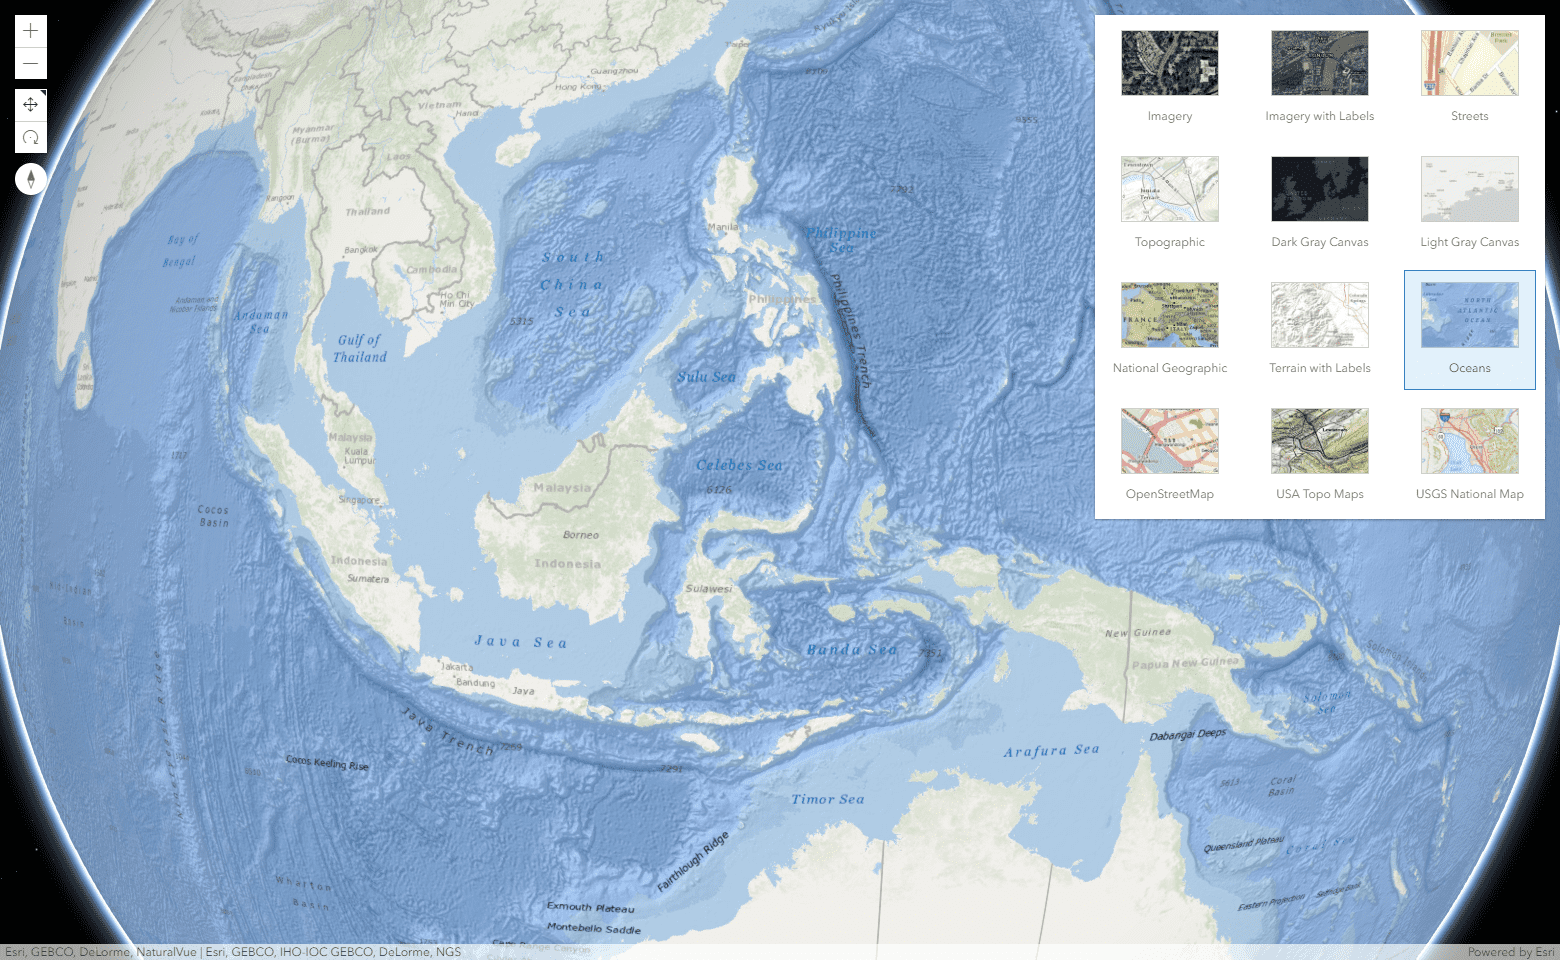
- Ready to use layers
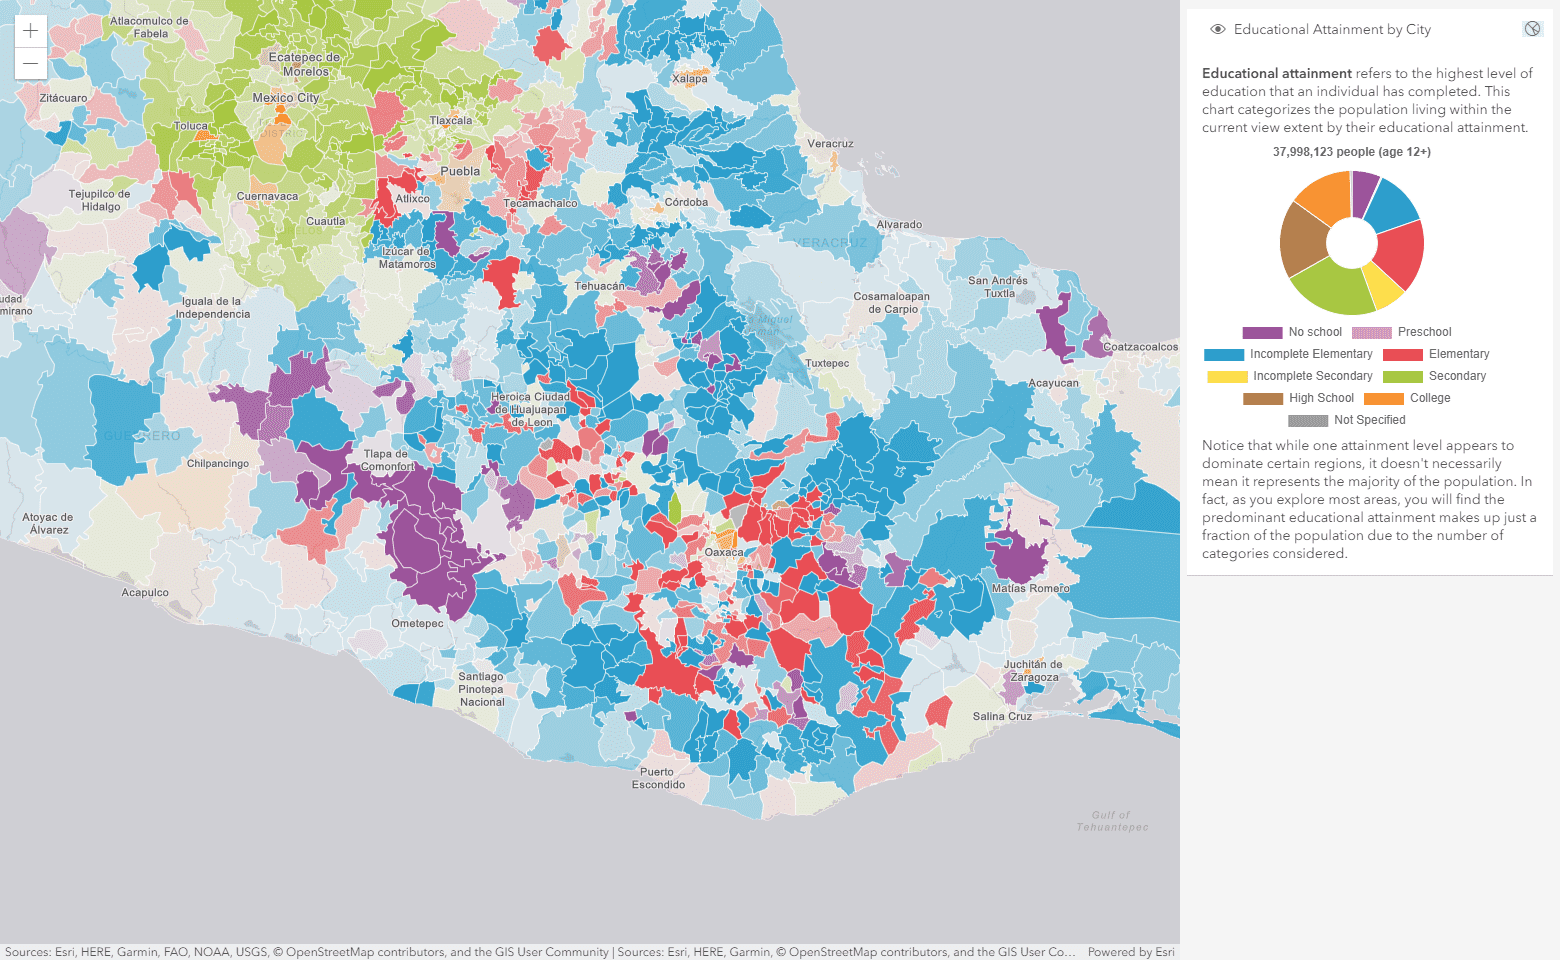
- Demographic data
- Spatial analysis
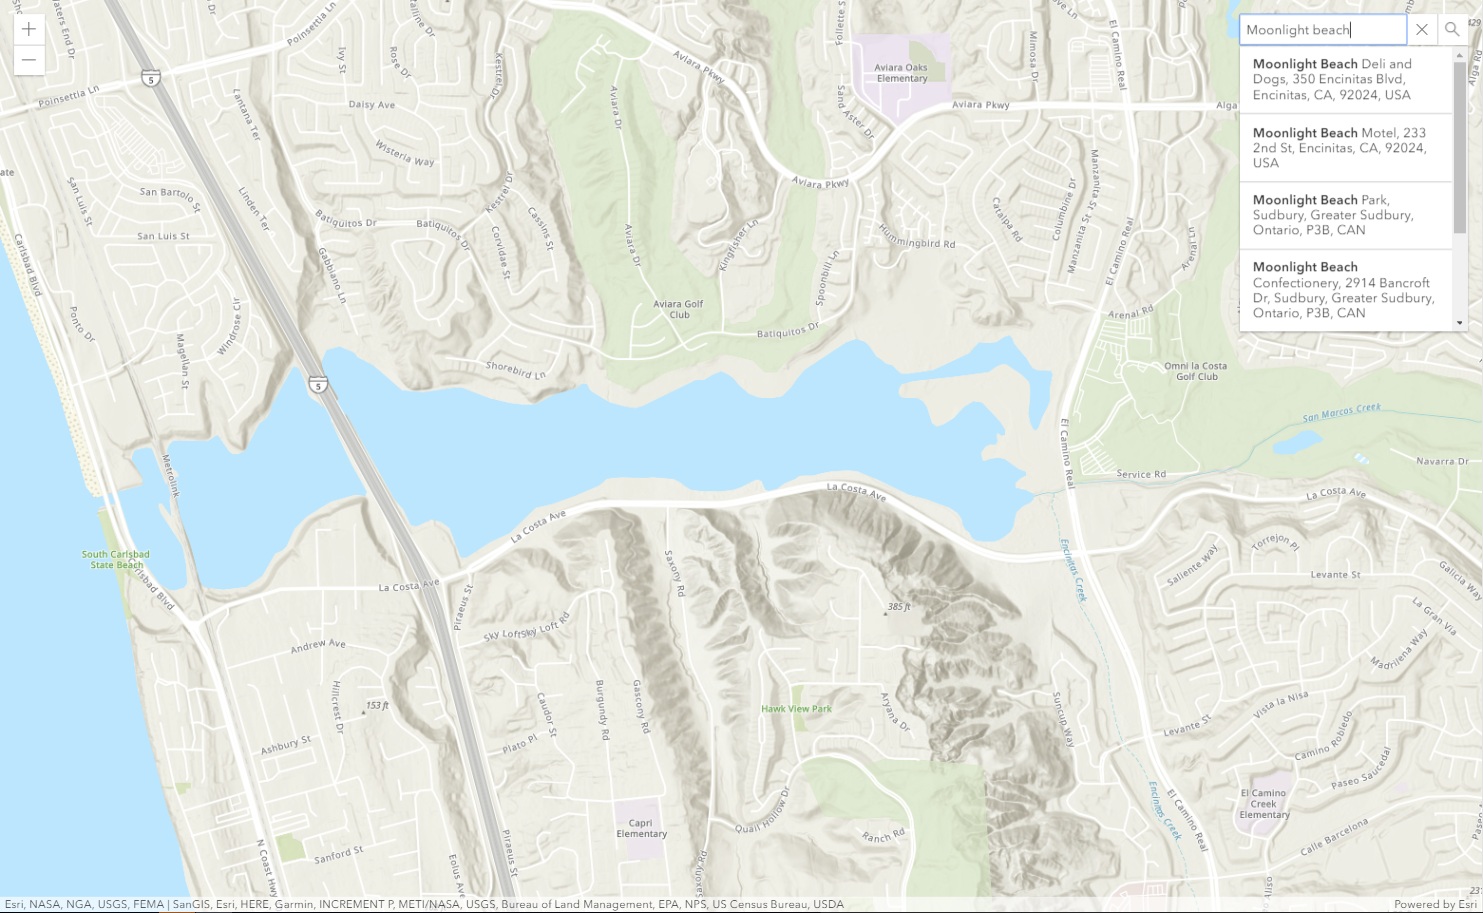
Find cities, addresses, and businesses worldwide using the search widget with one line of code.
Display optimized routes and generate turn-by-turn directions using real-time traffic.
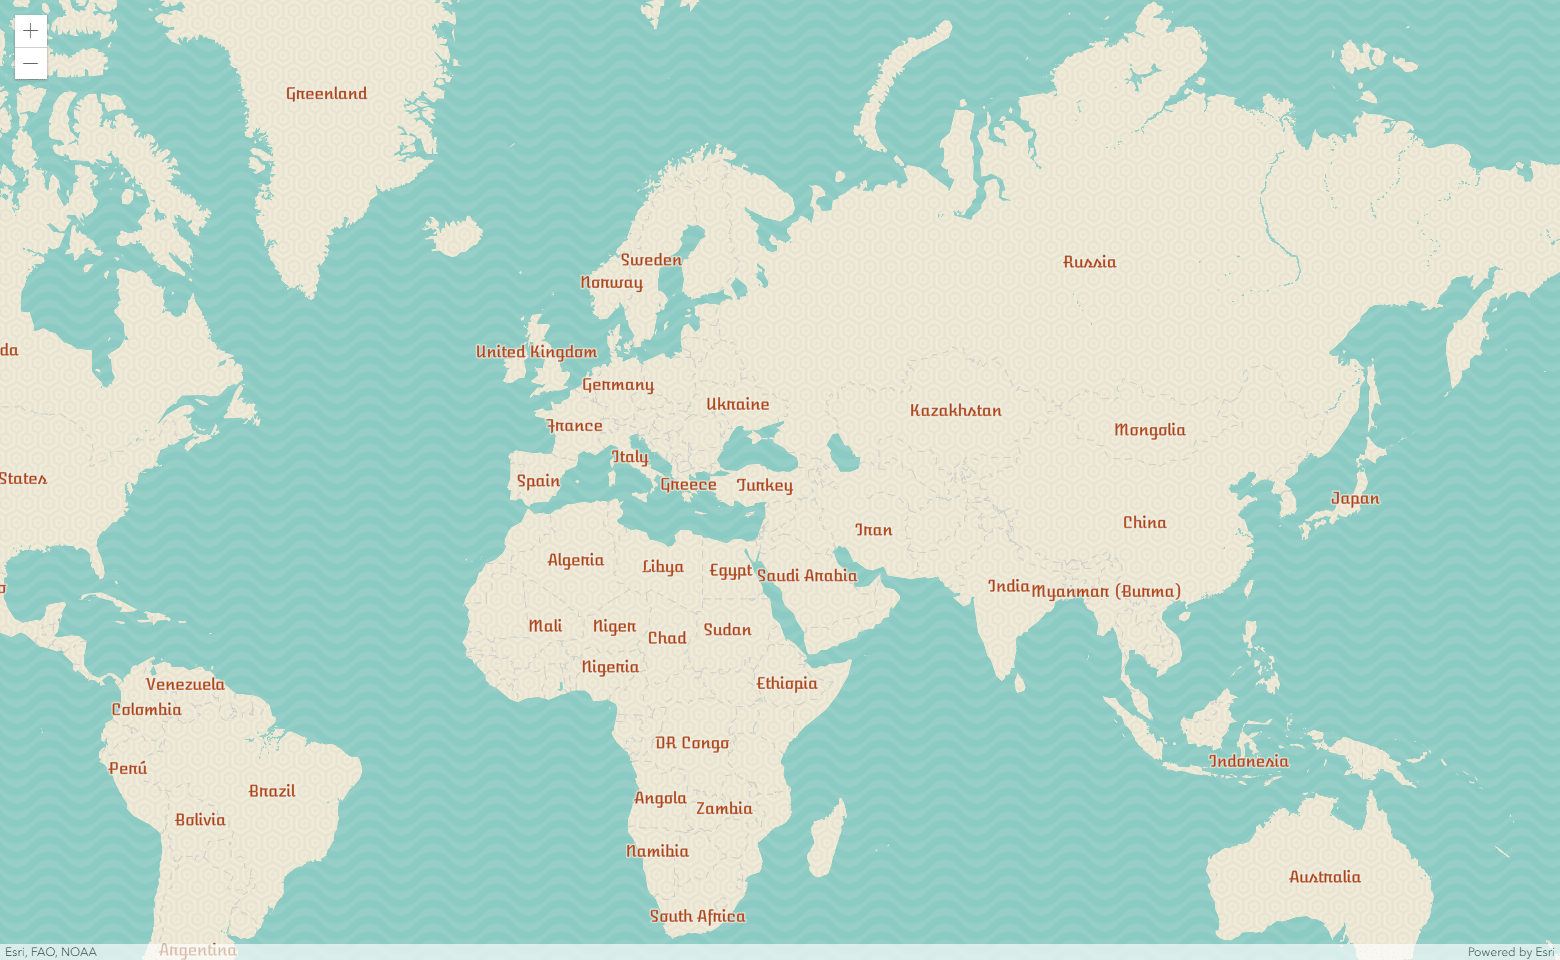
Access a variety of layers including vector basemaps, live data feeds, and scientific information.
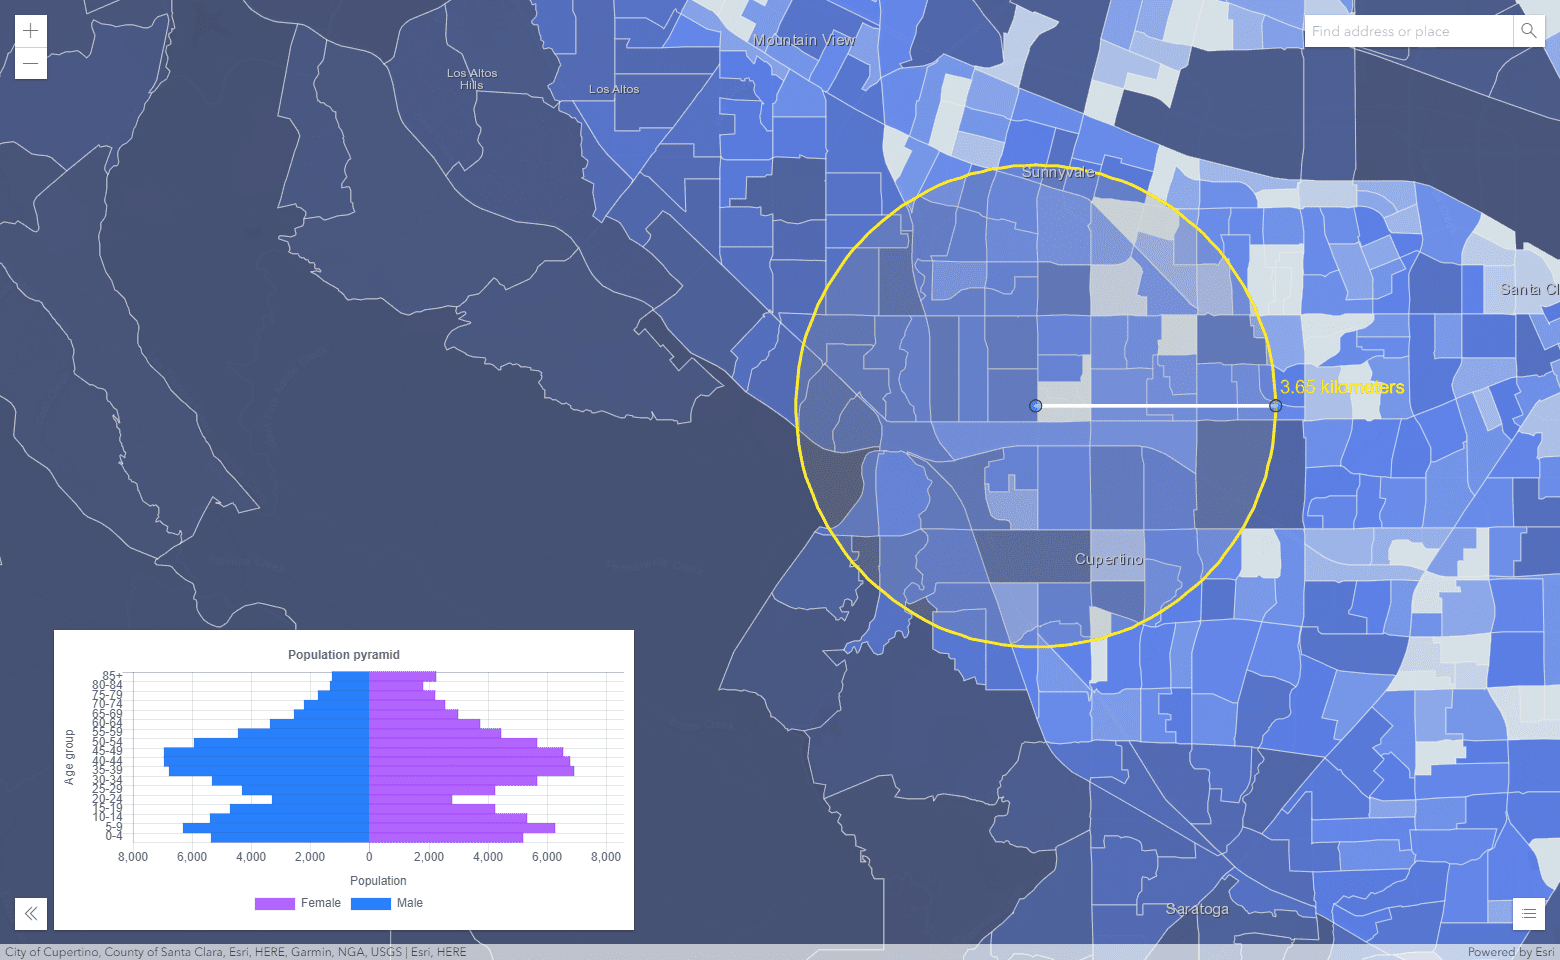
Grow a deeper understanding of the people, places, and businesses located near your places of interest.
Gain insight into your data by understanding spatial relationships and patterns.